
For investors who use technical analysis to find possible opportunities, the search often centers on two main questions: which stocks are in a good upward trend, and when is the best time to enter that trend. A structured way to do this is to look for stocks showing both good technical condition and a helpful price consolidation pattern, indicating a possible breakout is near. This approach tries to catch the next upward move in a stock's existing uptrend, giving a more distinct entry point with clear risk limits.
One stock now fitting these conditions is DOVER CORP (NYSE:DOV), a diversified industrial manufacturer. A recent search for technical breakout patterns has pointed to Dover as a candidate for more review by investors focused on technicals.
Looking at the Technical Condition
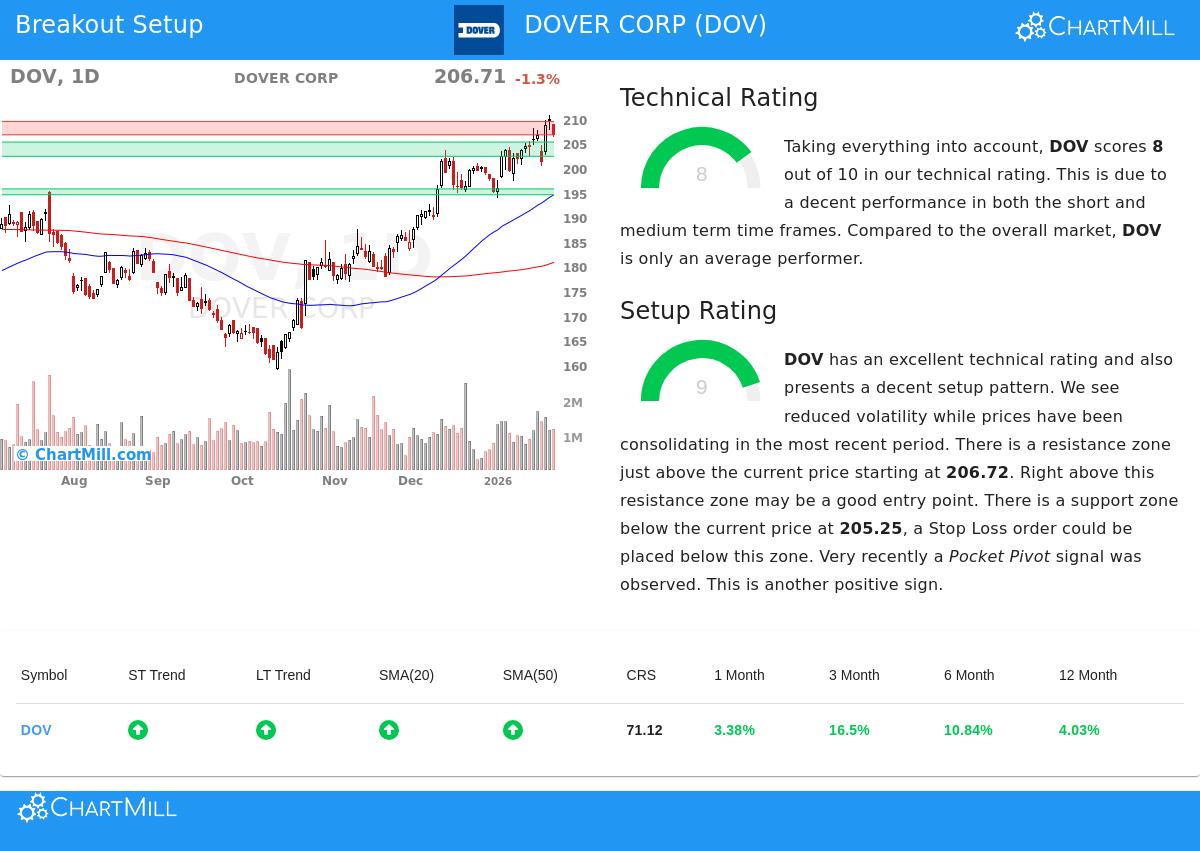
The base of a breakout plan is a stock's existing technical condition. A stock should already be in a verified uptrend to support expecting it to continue. Based on the ChartMill Technical Analysis report, Dover gets a good Technical Rating of 8 out of 10. This number measures the condition of the stock's trend over several periods.
The report lists several good elements adding to this rating:
- Trend Direction: Both the near-term and longer-term trends for DOV are rated as good, a clear sign that momentum is moving the same way across different timeframes.
- Moving Average Position: The stock is priced above all its main simple moving averages (20, 50, 100, and 200-day), and each of these averages is itself moving upward. This forms a stacked support base under the price.
- Relative Performance: While the stock is trading in the higher part of its 52-week range, the report states it has been a little behind the S&P 500's recent climb to new highs. This can occasionally offer a chance for a stock to gain ground if its own technicals stay healthy.
This mix of a good multi-timeframe trend and price trading above rising moving averages is exactly what the breakout search method looks for first, a technically "healthy" stock set for more advancement.
Looking at the Pattern Quality
A good trend by itself is not a signal to buy; entering after a fast, large move often results in buying at a high. The second, important step is finding a good pattern, which shows a time of consolidation or pause inside the larger uptrend. This consolidation lets the stock absorb its earlier gains and prepare for its next move, offering a more distinct entry point with more controlled risk.
Dover stands out here with a very good Setup Rating of 9. The technical report indicates a helpful pattern forming:
- Consolidation and Lower Volatility: Prices have been consolidating in a band between about $194 and $211 over the last month, with recent action showing lower volatility close to the top of this band.
- Clear Support and Resistance: The analysis notes a defined support area between $202.36 and $205.25, made by a combination of trendlines and moving averages. Just above the current price sits a defined resistance area between $206.72 and $209.44.
- Recent Buying Signal: A recent "Pocket Pivot" signal was observed, a pattern that frequently points to buying by larger participants during a consolidation phase, adding a positive element to the pattern.
This high setup score is key because it answers the "when" question. The existence of a tight consolidation close to highs, with clear nearby support and resistance levels, allows for a planned trade idea. A possible breakout above the $209.44 resistance could be used as an entry signal, with a stop-loss order set below the nearby support area to control risk.
A Possible Technical Situation
From this analysis, the automated report proposes a sample trade plan. It suggests an entry on a breakout above the resistance at $209.45, with an exit stop set at $202.35 below support. This would mean a risk of about 3.4% on the trade itself. It is important to note that this is a purely mechanical example taken from the technical levels; investors must always adjust any trade to their own risk comfort and verify the pattern with their own review.
Locating Comparable Chances
Dover Corp offers an example of how joining a good technical rating with a high-quality setup score can identify possible breakout candidates. For investors wanting to use this structured approach, new chances are searched each day.
You can locate today's list of technical breakout patterns by going to the Technical Breakout Setups screen.
Disclaimer: This article is for information only and does not form investment advice, a suggestion, or an offer to buy or sell any security. The technical analysis and any described trade ideas are based on automated measures and past data, which are not certainties of future results. Always do your own research, think about your financial position and risk comfort, and talk with a qualified financial advisor before making any investment choices.