
DOUGLAS ELLIMAN INC (NYSE:DOUG) has been identified by our stock screener as a potential candidate for high-growth momentum investors, while also meeting the technical criteria of Mark Minervini’s Trend Template. The stock exhibits strong price momentum, improving fundamentals, and a favorable technical structure.
Why DOUG Fits the Minervini Trend Template
Minervini’s Trend Template focuses on stocks in strong uptrends with clear technical strength. DOUG meets these criteria:
-
Price Above Key Moving Averages:
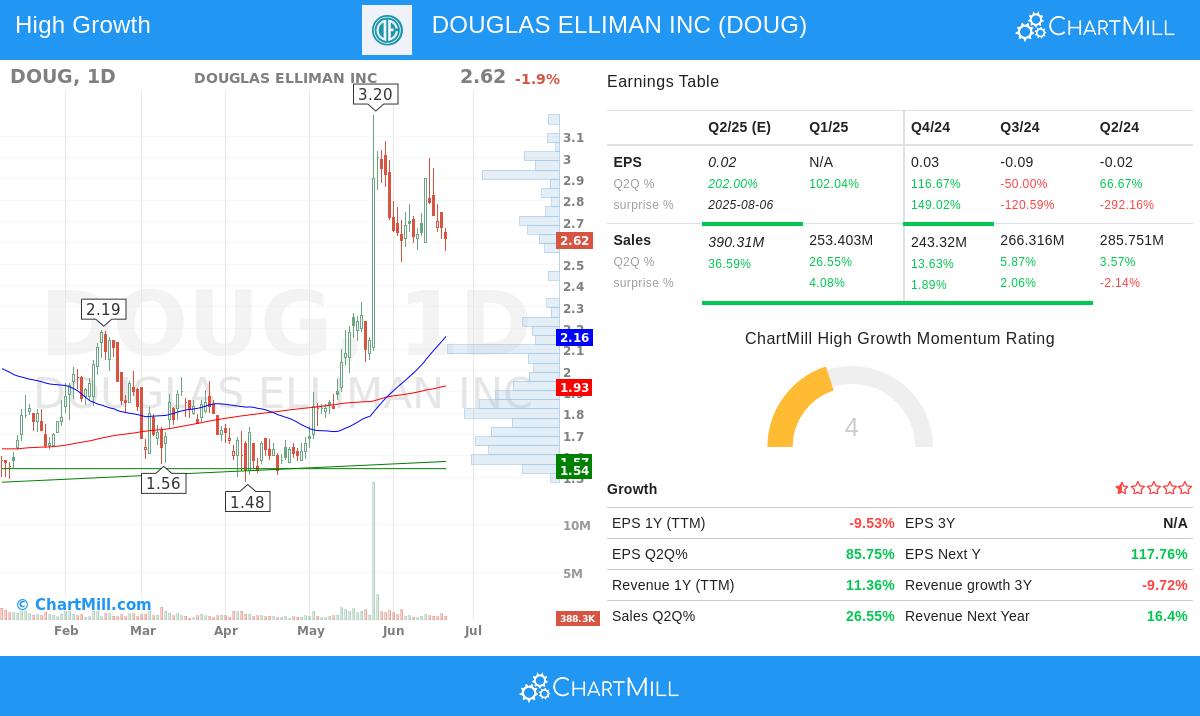
- Current price ($2.62) is above the 50-day ($2.16), 150-day ($1.98), and 200-day SMA ($1.93).
- The 50-day SMA is above both the 150-day and 200-day SMA, confirming bullish momentum.
- Both the 150-day and 200-day SMAs are trending upward.
-
Strong Relative Strength:
- DOUG’s relative strength (RS) score is 97.47, meaning it outperforms nearly 98% of stocks.
- The stock has gained 138% over the past year, significantly outpacing the broader market.
-
Price Near 52-Week High:
- The stock is trading within 18% of its 52-week high ($3.20) and 154% above its 52-week low ($1.03).
High-Growth Momentum Fundamentals
Despite recent earnings challenges, DOUG shows signs of accelerating growth:
-
Revenue Growth:
- Quarterly revenue growth (YoY) improved to +26.6% in the most recent quarter.
- Revenue estimates for the next quarter suggest +36.6% growth.
- The company has beaten revenue estimates in 3 of the last 4 quarters.
-
Earnings Recovery:
- EPS improved significantly in the latest quarter (+85.8% YoY).
- While still negative, losses are narrowing, and forward EPS estimates suggest further improvement.
-
Industry Leadership:
- DOUG outperforms 98% of stocks in the Real Estate Management & Development sector, indicating strong relative strength within its industry.
Technical Outlook & Setup
The technical report highlights:
- Strong Uptrend: Both short-term and long-term trends are positive.
- Support Levels: Key support zones at $2.61 and $1.54-1.57 provide downside protection.
- Resistance: The next major resistance is near $2.91-2.95.
While the setup rating is currently medium (5/10) due to recent volatility, the stock remains in a strong technical position.
For a deeper technical breakdown, review the full technical report.
Our High Growth Momentum + Trend Template screener lists more stocks with similar characteristics.
Disclaimer
This is not investment advice. Always conduct your own research before making investment decisions.