
For investors who use charts and price action to guide their choices, the idea of a "technical breakout" is a central strategy. The aim is to find stocks that are in a firm, clear uptrend and are also taking time to build a base. This building phase, frequently seen with lower volatility and a smaller price range, can prepare for the next move up. By joining a measure of a stock's general technical condition with a score that measures the strength of its current building pattern, traders try to find chances where a stock is ready to continue its upward path. This approach removes stocks that are only moving up without a sound place to enter, and those that are building a base but inside a poor or falling trend.
A recent search for such technical breakout patterns has identified Danaher Corp (NYSE:DHR) as a candidate for more review. The life sciences and diagnostics company shows a profile that matches the main parts of this strategy, showing both basic strength and a possibly useful short-term pattern.
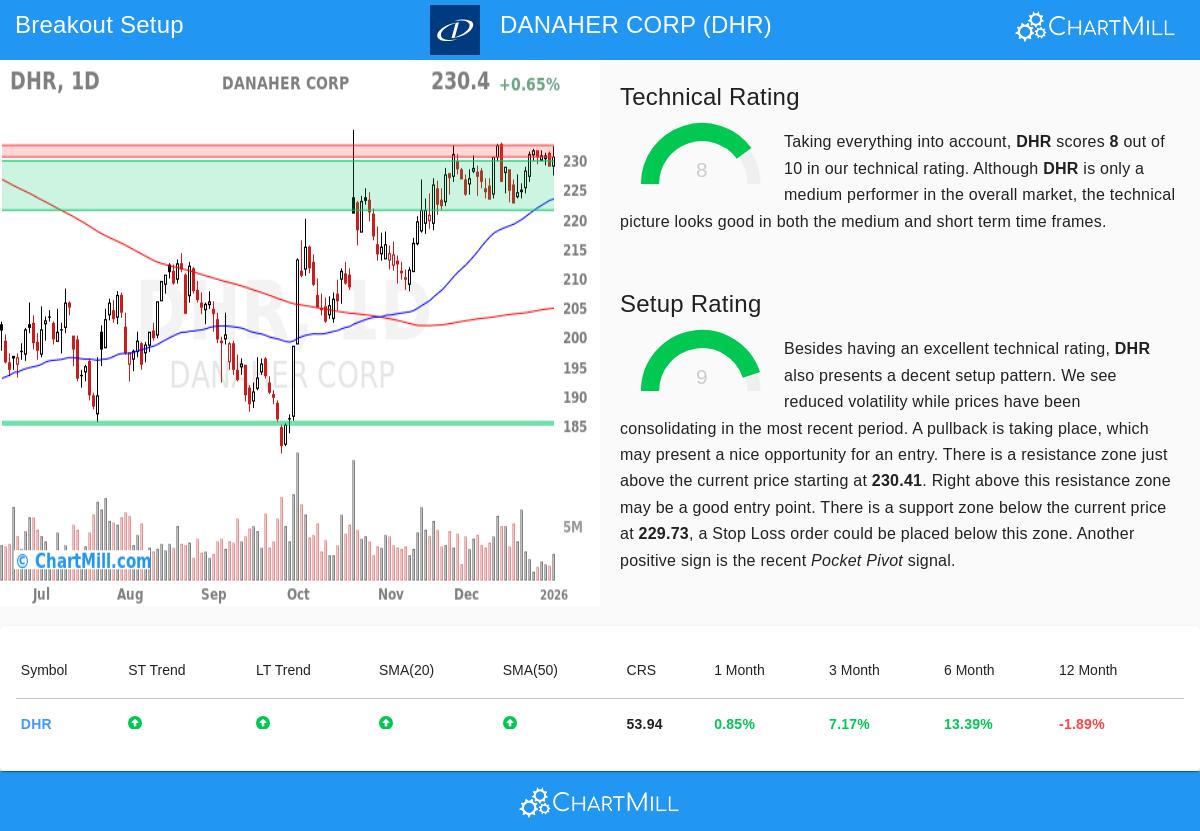
Reviewing the Technical Base
The first part of a breakout strategy is checking the stock's basic trend is good. A stock building a base inside a downtrend is frequently a problem, not a setup. Danaher's technical report shows a firm base.
- Firm Trend Agreement: Both the long-term and short-term trends for DHR are listed as good. This agreement across periods is a useful sign, implying the stock's momentum is not a short event but part of a larger, continued move.
- Sound Moving Average Position: The stock is trading above all its main simple moving averages (20, 50, 100, and 200-day), and each of these averages is itself in a rising arrangement. This ordered, rising moving average group is a standard sign of a sound uptrend.
- Stable Results: Over the last three and six months, DHR has gained about 7.2% and 13.4%, in that order, doing better than its 12-month result and showing recent good momentum.
This mix of items adds to the stock's firm ChartMill Technical Rating of 8. This rating measures the stock's technical condition, and a score of 8 puts DHR clearly in the group of stocks seen to be in an uptrend. For a breakout strategy, this firm technical rating is essential; it makes sure an investor is trying to buy into strength, not buy a declining stock.
Judging the Setup Strength
A firm trend by itself is not enough. Buying a stock that has just jumped can lead to quick declines. The second key part is finding a strong building phase, which gives a reasonable entry point and a clear area for risk control. This is where Danaher's present chart pattern becomes especially notable.
- Close Building Phase: The technical report states that over the past month, DHR has been trading in a fairly close range between about $222.60 and $232.80. This time of limited price movement after a rise is just the kind of building phase a breakout strategy looks for.
- High Setup Rating: This useful pattern is shown in Danaher's very good ChartMill Setup Quality Rating of 9. A high score here means the stock is forming a logical base, with prices building and volatility possibly going down, which often comes before a clear move.
- Clear Support and Resistance: The review finds a defined support area between $221.37 and $229.73, made by a group of moving averages and trendlines. On the other side, close overhead resistance is noted in the $230.41 to $232.38 range. This makes a clear plan: a breakout above resistance could show a continuation, while the support area below gives a reasonable level for a protective stop-loss order.
- Positive Signal: The report also notes a recent "Pocket Pivot" signal, a volume-based pattern that can point to buying during a building phase, adding another piece of positive detail to the setup.
A Possible Trade Plan
From this review, a technical trader might plan a possible breakout trade. The automated review proposes an entry point just above the found resistance area, near $232.39, which would confirm a breakout from the recent building phase. A stop-loss order could then be set below the nearby support area, around $223.36, to control risk. This states the trade's risk details clearly before entry, a basic rule of technical trading.
It is important to recall that no setup assures a win. The wider market condition, while now showing a good short-term trend for the S&P 500, can always change. Also, company-specific news or sector changes can outweigh any technical pattern.
For investors looking to search the market for similar technical chances, new breakout candidates are found each day using the Technical Breakout Setups screen.
Disclaimer: This article is for information only and is not investment advice, a suggestion, or an offer or request to buy or sell any securities. The review provided is from technical data and should not be the only reason for an investment choice. All investing has risk, including the chance of losing the original amount. Always do your own study and think about your money situation and risk comfort before making any investment choices.