
For investors who use chart patterns to find possible opportunities, the idea of a technical breakout is a central method. The aim is to locate stocks that are both in a firm, steady uptrend and also pausing to gather their gains. This gathering phase, frequently shown by lower volatility and a narrow price range, can prepare for the next upward move. A structured way to locate these situations involves searching for stocks that rate well on both a long-term technical condition score and a short-term formation quality score. This process sorts for leading companies that are resting, possibly giving a good risk-reward chance for the next breakout.
Danaher Corp (NYSE:DHR), a top worldwide company in life sciences and diagnostics, now shows a profile that fits this technical breakout method. The company's stock displays the two traits that technical searches look for: fundamental condition and a tightening formation.
Reviewing the Technical Base
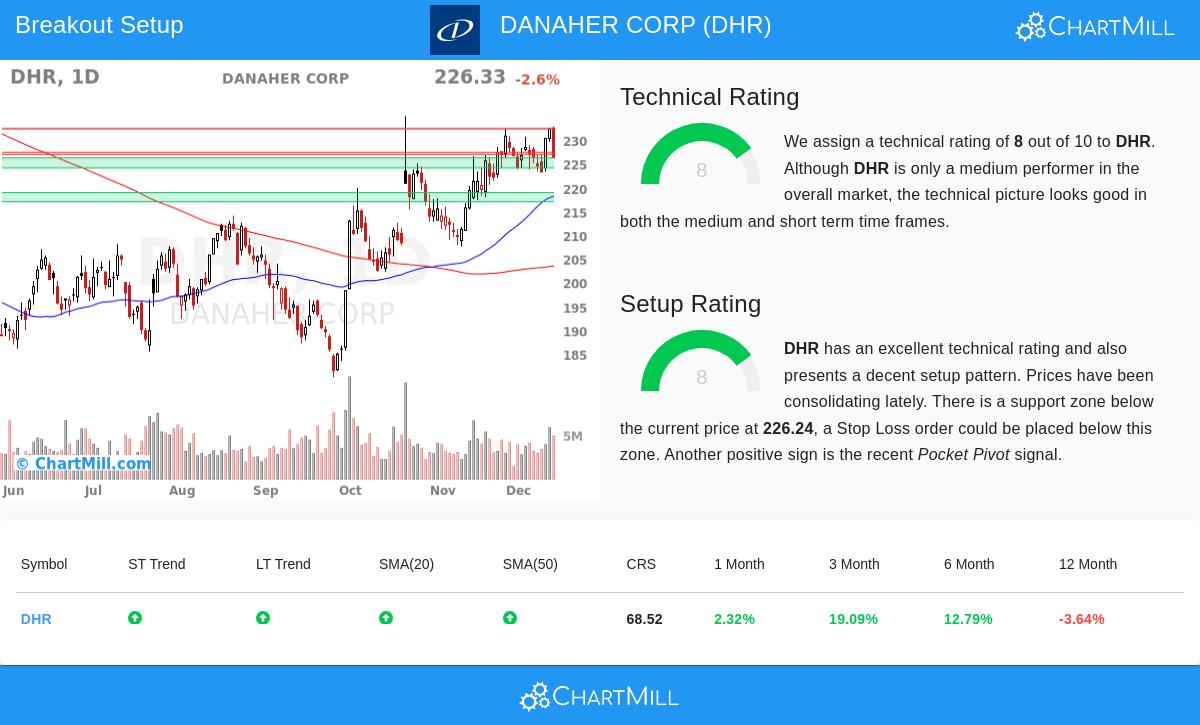
The first part of a breakout method is verifying the stock's general technical condition and trend direction. A high technical score shows a stock is in a lasting uptrend, which is important because breakouts from poor or falling stocks have a much higher chance of not working. Danaher's technical analysis report gives it a solid score of 8 out of 10, indicating a technically sound base.
Important elements adding to this score are:
- Good Trend Agreement: Both the near-term and long-term trends for DHR are scored as good. This agreement across periods points to steady buying interest and lowers the chance of a wrong signal.
- Firm Moving Average Backing: The stock is priced above its main moving averages (20, 50, 100, and 200-day), and all these averages are arranged in a rising order. This layered order of backing levels is a typical sign of a sound uptrend.
- Steady Results: Over the past three and six months, DHR has shown increases of about 19% and 13%, in that order, proving continued force even as it gathers near its recent peaks.
This firm technical setting means that if a breakout happens, it is more probable to be backed by the existing market forces instead of being a single, short-lived event.
Examining the Formation Quality
A firm trend by itself is not a reason to buy; getting in during a steep climb often results in buying at a high. The second key part is the formation quality, which finds gathering phases inside the larger uptrend. Danaher gets an 8 out of 10 on this measure too, showing a high-standard gathering pattern.
The present formation for DHR displays a number of positive signals for a possible breakout:
- Price Gathering: The report states that prices have been gathering lately, moving in a band between about $217 and $233 over the last month. This pause lets the stock reduce overbought states and form a new base of backing.
- Clear Backing and Limit: The study notes a definite backing area between $224.14 and $226.24, made by a meeting of trendlines and moving averages. Just above, a limit area is between $226.94 and $227.40. This small space between backing and limit makes a clear line for traders to observe for a breakout confirmation.
- Supporting Volume Sign: A recent "Pocket Pivot" sign was seen, which is a volume-based sign pointing to accumulation—where shares are shifting from less committed to more committed holders—often before a price rise.
This high formation score addresses the "when" question for technical investors. It indicates the stock is not stretched but is instead tightening, supplying a sensible area to set risk (just under the backing area) and a clear line to confirm a new upward push.
A Possible Technical Situation
From this study, the technical report describes an example trading situation. It proposes a possible entry on a breakout above the limit at $227.41, with a protective stop loss set under the backing area at $224.13. This would set a risk of about 1.44% on the trade. It is very important to know this is an example made from the technical levels; investors must always adjust entry, exit, and trade size to their own risk comfort and plan.
Locating Like Chances
Danaher Corp shows the kind of chance that technical breakout searches are made to find. For investors wanting to use this approach to the present market, new possible formations are found each day.
You can see the newest technical breakout choices by going to the Technical Breakout Setups screen.
Disclaimer: This article is for information only and is not investment advice, a suggestion, or a deal to buy or sell any security. The technical study and example trade talked about are from past data and are not promises of future results. Always do your own study and think about your money situation and risk comfort before making any investment choices.

