
For investors who use charts and price action to guide their choices, the search for promising opportunities often involves finding stocks that are both technically sound and ready for a possible move. One methodical way to do this is using a Technical Breakout screen, which looks for stocks showing two main traits: a high Technical Rating, showing good underlying trend condition, and a high Setup Quality Rating, indicating a consolidation pattern that might come before a new rise. This process tries to find candidates where a solid trend is briefly pausing, possibly giving a good risk-reward entry point for the next breakout.
A recent scan using this process has identified DOLLAR GENERAL CORP (NYSE:DG) as a notable candidate. The discount retailer’s stock seems to be forming an interesting technical pattern, backed by high ratings from ChartMill’s own analysis system. A review of the detailed technical report shows the specific details behind this view.
Technical Strength: A Base of Momentum
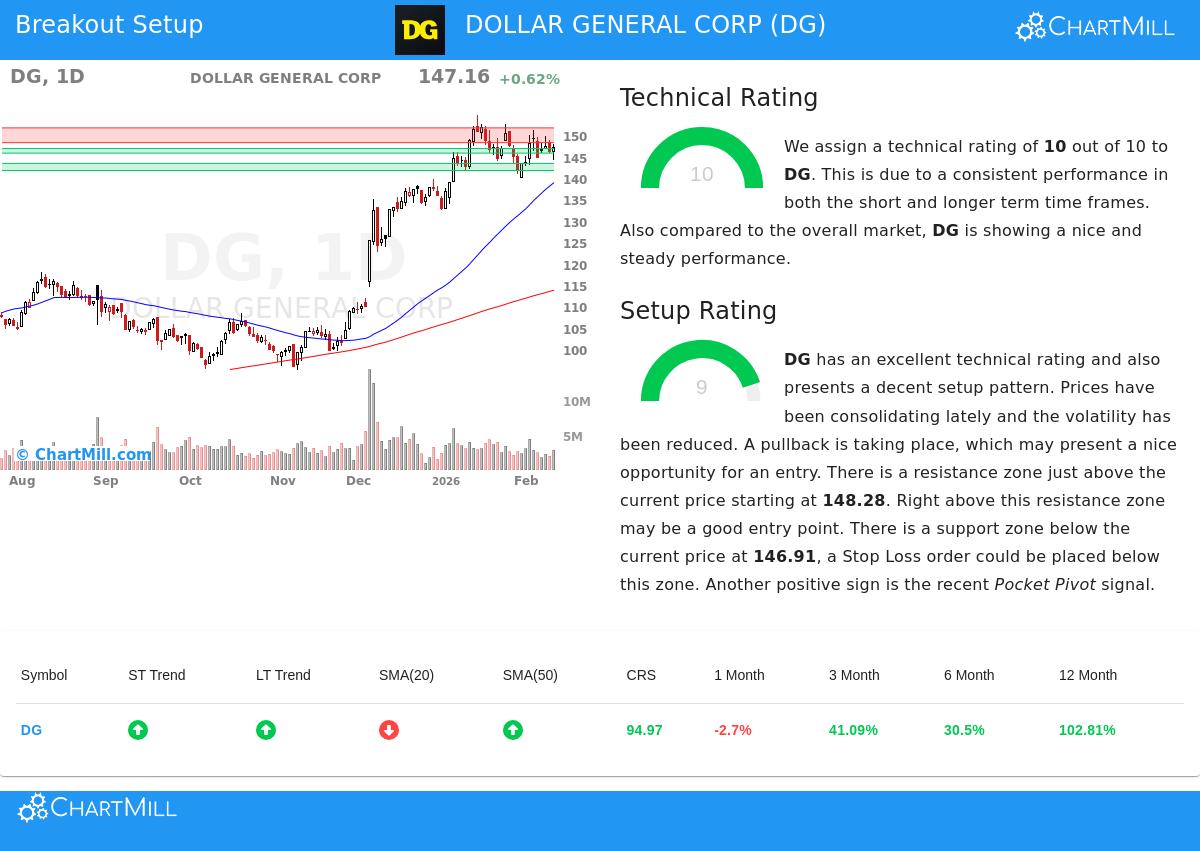
The start of the breakout strategy is finding stocks in a confirmed uptrend, as a sound technical base raises the chance that a breakout will continue. Dollar General’s technical condition is very sound, receiving a top Technical Rating of 10 out of 10. This number combines several trend and momentum details across different time periods.
Important parts supporting this high rating are:
- Positive Trends: Both the long-term and short-term trends for DG are seen as positive, a pairing that implies aligned and steady buying pressure.
- Better Relative Strength: The stock is doing better than 94% of all stocks in the market over the last year and is in the 94th percentile within its Consumer Staples Distribution & Retail industry. This shows notable leadership.
- Sound Moving Average Alignment: The stock is trading above its important moving averages (20, 50, 100, and 200-day), which are all in rising arrangements. This stacked order is a typical sign of a good uptrend.
- Good Performance: With a 12-month increase of over 102% and a 3-month return of 41%, the price action confirms the condition measured by the rating.
This very good technical condition is key for the strategy because it implies the stock is seeing institutional buying and has a better chance of continuing its upward path once it moves out of its current consolidation.
Setup Quality: A Pattern of Consolidation
While a solid trend is needed, it is not enough for a best entry. A stock that has risen sharply may be overextended and likely to pull back. The strategy, therefore, looks for stocks that are pausing, forming a tight consolidation pattern. This is where the Setup Quality Rating becomes important, as it measures the "base-building" phase. Dollar General gets a 9 out of 10 on this measure.
The analysis indicates a standard setup forming:
- Lower Volatility Consolidation: The report mentions "lower volatility while prices have been consolidating in the most recent period." Over the last month, DG has traded in a band between $140.00 and $154.75 and is now consolidating in the middle of this band after a recent pullback.
- Clear Support and Resistance: The setup finds a defined support area between $145.83 and $146.91, made by a mix of trendlines and moving averages. Just above the current price sits a defined resistance area between $148.28 and $151.74.
- Favorable Volume Signal: A recent "Pocket Pivot" signal was seen, which is a price/volume pattern often linked to accumulation by bigger investors, adding a positive detail to the setup.
This high-grade consolidation is just what the breakout screen is made to find. It gives a clear plan for trade management: a possible entry point just above the resistance area (around $151.75) to confirm a breakout, with a sensible stop-loss level set below the nearby support area (around $145.82) to handle risk.
A Candidate for Watchlists
The pairing of a top Technical Rating and a very high Setup Rating makes Dollar General a clear example of what technical investors using this breakout process look for. It shows a leading stock in the market that has paused to absorb its large gains, possibly preparing for its next directional move. The defined price levels give a structured way to plan an entry, fitting with the disciplined, rules-based method that technical analysis supports.
It is important to remember that the automatically created entry and exit levels are examples, based on the closest support and resistance. Investors should always do their own study, thinking about details like overall market conditions, currently positive for the S&P 500, and personal risk tolerance before acting on any setup.
Interested in finding more possible breakout setups like this one? You can run the same screen daily to find new opportunities by visiting the Technical Breakout Setups page on ChartMill.
,
Disclaimer: This article is for informational purposes only and does not constitute investment advice, a recommendation, or an offer or solicitation to buy or sell any securities. The analysis presented is based on technical metrics and should not be the sole basis for any investment decision. Investing involves risk, including the potential loss of principal. Always conduct your own due diligence and consider consulting with a qualified financial advisor before making any investment decisions.