
CyberArk Software Ltd (NASDAQ:CYBR) has appeared as a notable option for investors using systematic growth strategies, especially those informed by Mark Minervini's methodology. The stock was found through a screening process that joins Minervini's strict Trend Template with a High Growth Momentum (HGM) rating, a two-part method intended to find companies displaying both solid technical momentum and sound fundamental growth traits. This pairing aims to find stocks in strong uptrends that are also backed by improving business fundamentals.
Meeting the Minervini Trend Template
A fundamental part of the Minervini strategy is the Trend Template, a group of technical requirements that finds stocks in a confirmed Stage 2 uptrend. CyberArk shows a close adherence to these conditions, indicating very good technical condition.
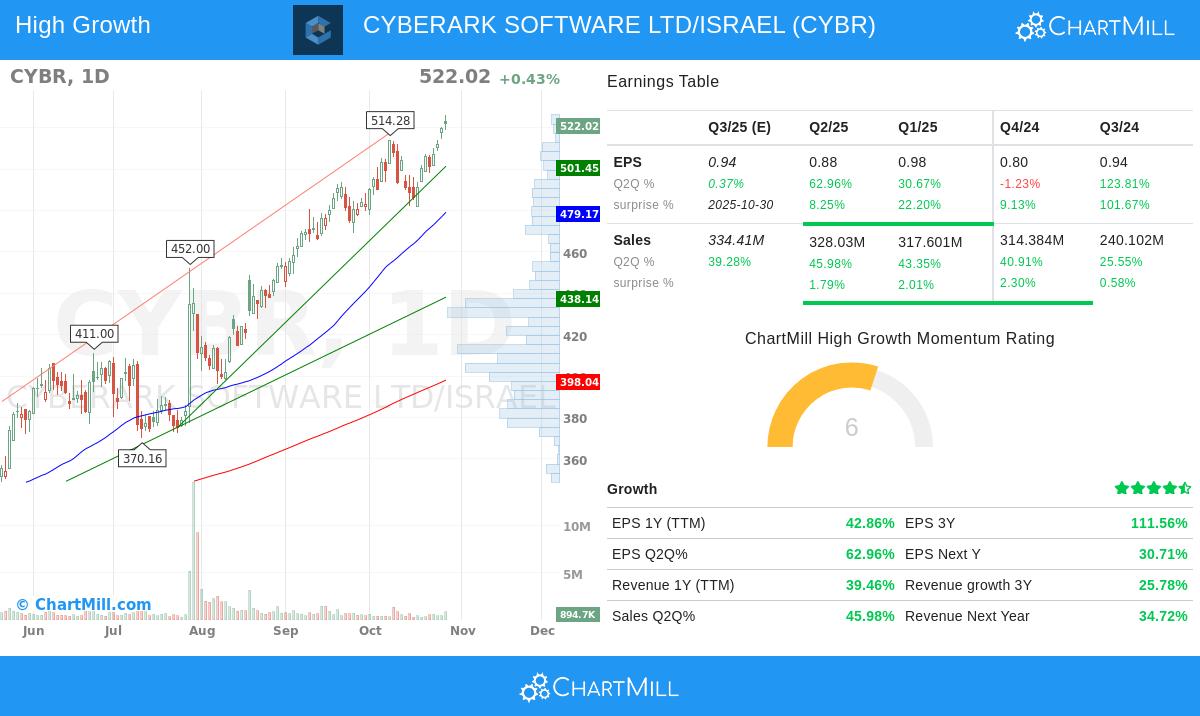
- Price Above Key Moving Averages: The stock is trading well above its rising 50-day ($479.17), 150-day ($409.71), and 200-day ($398.04) simple moving averages. This arrangement confirms strength across short, intermediate, and long-term timeframes.
- Moving Average Alignment: The 50-day moving average is positioned above both the 150-day and 200-day averages, while the 150-day is above the 200-day. This sequential positive arrangement, known as a "stacked" configuration, points to continued and increasing buying pressure.
- Proximity to Highs: With a current price of $522.02, CYBR is trading within 1% of its 52-week high of $526.19, a key Minervini principle that indicates the stock is under strong accumulation and lacks overhead supply.
- Significant Advance from Lows: The stock's price is approximately 92% above its 52-week low of $271.68, showing a strong recovery and continued uptrend.
- Superior Relative Strength: CyberArk holds a ChartMill Relative Strength rank of 92.31, meaning it has performed better than over 92% of the market. Minervini states that true market leaders must show better relative strength, and a reading above 70 is a main filter in his strategy.
Qualifying as a High-Growth Investment
Beyond its technical strength, CyberArk's attraction is based on its fast fundamental growth, which fits well with the "high growth momentum" part of the screen. The company's financial performance displays the type of improvement that growth investors look for.
- Earnings Growth Acceleration: The company has shown notable earnings per share (EPS) growth. On a trailing twelve-month (TTM) basis, EPS grew 42.9%. More notably, the most recent quarterly EPS increased 63% year-over-year, a clear improvement from the 30.7% growth in the prior quarter. This pattern of improving growth is a characteristic of companies seeing strong demand and operational efficiency.
- Consistent Earnings Surprises: CyberArk has exceeded analyst EPS estimates in each of the last four quarters, with an average beat of 35.3%. These repeated positive surprises frequently act as a catalyst, leading analysts to revise future estimates higher and drawing institutional interest.
- Sound Revenue Expansion: The company's top-line growth is similarly notable, with TTM revenue growing 39.5%. The last quarter saw sales increase 46% year-over-year, keeping a solid trend from the previous quarter's 43.4% growth. This shows the company is effectively taking advantage of its market opportunity.
- Strong Cash Flow Generation: Free cash flow per share has grown substantially, increasing over 834% in the past year to $4.11. This major improvement indicates good operational condition and the ability to internally fund future growth projects.
Technical Health and Setup Assessment
The complete technical analysis report for CyberArk gives it a perfect rating of 10 out of 10, reflecting its excellent technical condition. The long-term and short-term trends are both rated as positive, and the stock is trading near new highs, confirming its leadership status. The report also finds several key support levels, with the most immediate located in the $501-$503 range, which could act as a possible area for new entries on any pullback.
However, the analysis observes that while the technical rating is very good, the current setup quality is rated a 3. This indicates that after its strong advance, the stock may be overstretched and could profit from a period of consolidation to form a more defined base, such as a Minervini Volatility Contraction Pattern (VCP), which would present a lower-risk entry point.
You can review the full, detailed technical breakdown in the ChartMill Technical Report for CYBR.
Finding Similar Opportunities
For investors interested in locating other stocks that fit this solid combination of strong technical trends and high-growth fundamentals, the screening methodology that found CyberArk is a useful starting point. You can examine current results from this "High Growth Momentum + Trend Template" screen by following this link: View High Growth Momentum + Trend Template Screen Results.
Disclaimer: This article is for informational and educational purposes only and does not constitute investment advice. The analysis is based on publicly available data and a specific screening methodology. Investors should conduct their own due diligence and consider their individual financial situation and risk tolerance before making any investment decisions. Past performance is not indicative of future results.