
For technical investors looking to find stocks ready for their next rise, a frequent method involves selecting securities that show solid technical action and are building a constructive consolidation pattern. This method tries to capture the momentum of leading stocks as they finish periods of rest. A useful way to apply this is by using tools like ChartMill's Technical Breakout Setups screen, which merges two proprietary scores: the Technical Rating, which measures the general condition and direction of a stock, and the Setup Quality Rating, which evaluates if the price action is building a logical base with a distinct possible entry point. The aim is to find stocks where sound basic strength is paired with a tightening price formation, hinting a breakout might be near.
A First-Class Technical Picture
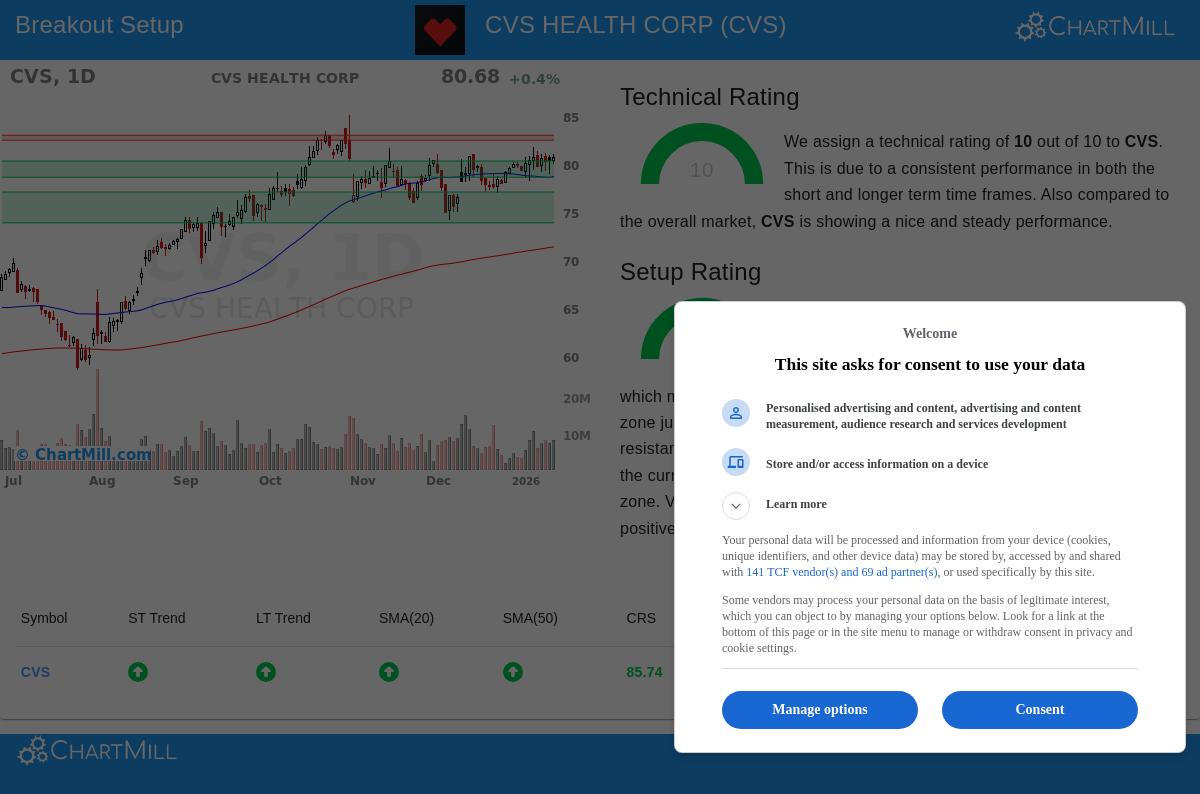
Central to any breakout candidate is a fundamentally good technical direction. CVS Health Corp (NYSE:CVS) performs very well here, receiving a complete Technical Rating of 10 out of 10. This top score shows notable strength across many timeframes and measures. A close look at the full technical report shows the foundations of this positive formation:
- Trend Agreement: Both the near-term and longer-term trends for CVS are decidedly positive, a main trait of a stock in a continued upward direction.
- Relative Performance: The stock has done much better than the wider market, performing better than 85% of all other stocks over the last year. It also sits in the top quarter of its Health Care Providers & Services industry group.
- Moving Average Backing: The stock is priced above all its main moving averages (20, 50, 100, and 200-day), and each of these averages is itself in a rising pattern, showing broad positive momentum.
- Market Level: CVS is trading in the higher part of its 52-week range, showing it is in a definite cyclical upward trend.
This mix of factors is exactly what the Technical Rating is built to measure. A high rating verifies the stock is a market leader with momentum, which is the required first step for the breakout method. A solid trend gives the directional bias that raises the chance of a good breakout continuation.
A Superior Setup for Entry
While a solid trend is needed, it is not enough for a well-timed entry. A stock can be technically very good but stretched, giving a poor risk/reward situation. This is where the Setup Quality Rating becomes important. CVS currently has a Setup Rating of 9, meaning its price action is forming a logical pattern that might give a lower-risk entry chance.
The technical report notes that prices have been moving sideways lately inside a set range. This time of contraction after a previous rise is a standard trait of a base-building formation. For a trader, this consolidation gives two key reference points:
- A Set Resistance Area: A clear resistance area is seen between $82.52 and $83.04. A clear move above this area could mark the restart of the upward trend and act as a possible breakout trigger.
- A Close Support Area: A firm support zone exists between $78.65 and $80.34, made by a meeting of trendlines and moving averages. This gives a sensible level below which to set a protective stop-loss order, clearly stating the trade's risk.
The report also mentions the recent appearance of a "Pocket Pivot" signal, a volume-based formation that hints at buying by larger investors during the consolidation, an extra good sign for the setup's quality. The high Setup Rating confirms that the stock is not just trending, but is doing so in a structured way that allows for tactical planning of entry and exit points.
Combining the Elements
For technical investors, CVS shows a strong example of the breakout method. The stock's complete Technical Rating verifies it is a solid performer in a confirmed upward trend, fitting the "which stock" requirement. Its high Setup Rating then answers the "when" question, meaning the stock is now in a constructive pause, giving a clear resistance level to monitor for a breakout signal and a close support level to handle risk.
This mix of top technical condition and a superior setup formation is just what the Technical Breakout Setups screen is built to find. It sorts the market to show stocks where firm trends and practical chart patterns meet.
Find Other Possible Breakout Setups
The review of CVS shows the kind of chance this screening approach can find. Investors wanting to use this method to find other possible breakout candidates can view the live results of the Technical Breakout Setups screen here. New setups are created each day using the newest market data.
Disclaimer: This article is for informational purposes only and does not constitute investment advice, a recommendation, or an offer to buy or sell any security. The analysis is based on technical metrics and automated screening tools. Always conduct your own due diligence, consider your individual financial situation and risk tolerance, and consult with a qualified financial advisor before making any investment decisions. Past performance is not indicative of future results.