
For investors who use charts and price action to guide their choices, a methodical way to spot possible opportunities is important. One method looks for stocks that are in a solid technical uptrend and also moving in a narrow band, indicating a possible breakout may be near. This plan centers on two specific metrics: the ChartMill Technical Rating, which measures the general condition and direction of a stock, and the ChartMill Setup Quality Rating, which evaluates the state of its present basing pattern. By joining a high score in both areas, traders try to locate stocks with good technicals at a favorable entry point. A recent filter using this approach has identified CVS Health Corp (NYSE:CVS) as a candidate deserving further examination.
Technical Strength: A Base of Momentum
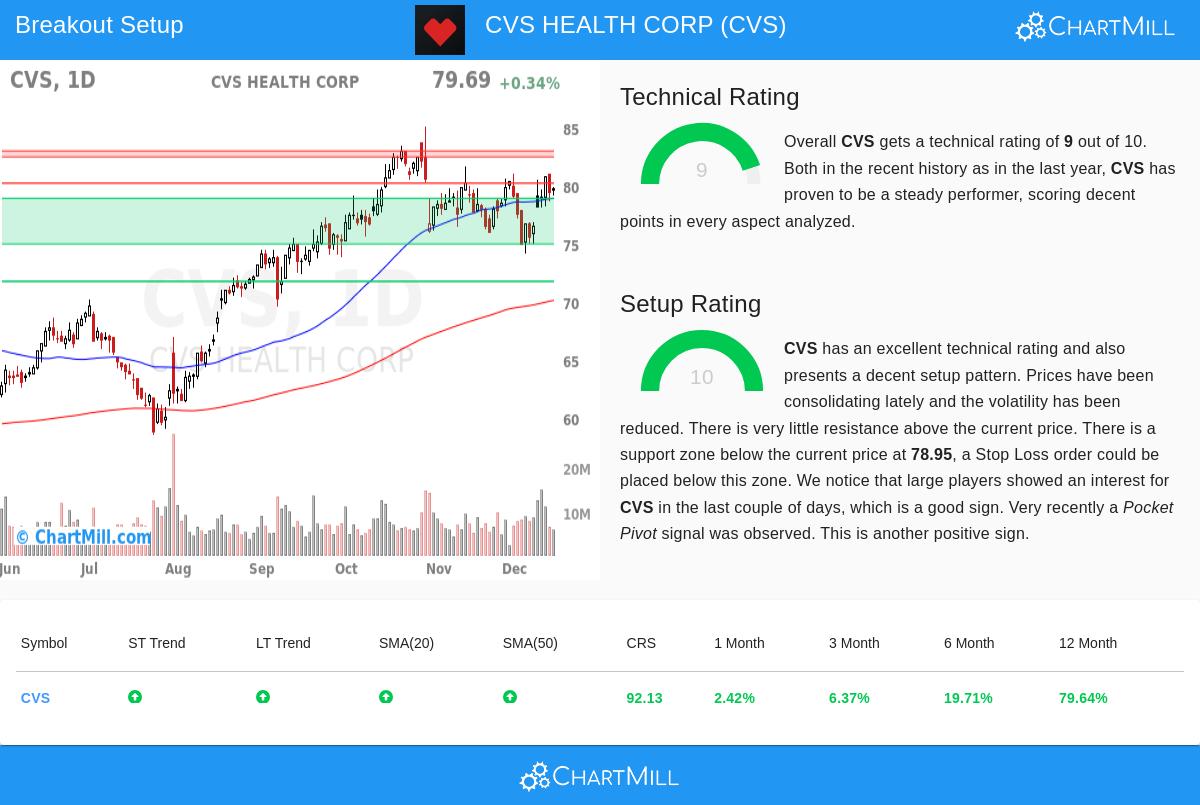
The first part of this breakout plan is a stock's fundamental technical strength, as a solid trend gives the momentum required for a good breakout. CVS Health Corp shows very good strength here, receiving a nearly perfect Technical Rating of 9 out of 10. A close look at the technical analysis report shows a stock performing well in many aspects.
- Trend Direction: Both the short-term and long-term trends for CVS are clearly positive. This agreement across time periods is a strong sign, showing continued buying interest and lowering the chance of an abrupt trend change.
- Market and Sector Performance: CVS is doing better than 92% of all stocks in the market over the last year, putting it clearly with the market leaders. Inside its own Health Care Providers & Services industry, it performs better than 83% of similar companies.
- Moving Average Backing: The stock's price is above all its main simple moving averages (20, 50, 100, and 200-day), and each of these averages is itself in an upward pattern. This layered arrangement of rising support levels is a typical feature of a sound uptrend.
- Good Returns: The stock has provided significant returns across several periods, including a 19.7% gain over six months and a marked 79.6% rise over the last twelve months.
This solid technical picture is exactly what the breakout plan looks for. A high Technical Rating verifies that CVS is not a speculative jump but a stock with confirmed, high-quality momentum, giving a positive setting for a new upward move.
Setup Quality: The State of the Basing Period
While a solid trend is needed, it is not enough for a perfect trade setup. A stock that has moved up quickly may be "overbought" and likely to decline. The second important filter, then, is the Setup Quality Rating, which finds times of basing or resting. CVS does very well here too, getting a perfect Setup Rating of 10.
The analysis shows CVS has been trading in a set band over the last month, between about $74.14 and $81.08. This time of lower volatility and sideways movement lets the stock absorb its earlier gains and form a new base of support. For a trader, this makes a clear structure:
- Set Risk: A support area is found between $75.00 and $78.95, made by a combination of trendlines and moving averages. This gives a reasonable zone below which to set a protective stop-loss order, clearly setting the risk of the trade.
- Clear Trigger: The immediate resistance level is seen at $80.26. A clear move above this price would show a breakout from the recent basing period, possibly starting the next upward move. The plan proposes an entry just above this level to confirm the breakout has started.
- Confirming Signs: The report notes more interest from large investors (measured by Effective Volume) and a recent "Pocket Pivot" sign, a particular price and volume pattern often linked to institutional buying. These are seen as positive confirmations inside the setup.
This high-grade basing period is the "when" of the plan. It answers the important question of timing, offering a possible entry point with a close, clearly set level to control risk, which is necessary for carrying out a careful breakout trade.
A Specific Trading Plan
Based on the analysis of technical strength and setup quality, the report describes a sample trading plan. It proposes an entry point at $80.27 (a buy-stop order set just above the $80.26 resistance) with a stop-loss order at $74.13 (set below the recent basing low and the identified support zone). This setup establishes a maximum risk of about 7.65% on the trade itself. It is important to know this is an example made from the technical factors, not a suggestion. Every investor must adjust their entry, exit, and position size to their own risk comfort and complete plan.
Locating Other Possible Breakouts
The example of CVS Health Corp shows how joining high Technical and Setup Ratings can find practical chart patterns. For investors wanting to find similar opportunities each day, this filtering method is easily available. You can review the present list of technical breakout setups by going to the Technical Breakout Setups screen.
Disclaimer: This article is for information only and does not form investment advice, a suggestion, or an offer to buy or sell any security. The analysis is based on technical data and automated scoring models. Investors should do their own research, think about their financial position and risk comfort, and talk with a qualified financial advisor before making any investment choices. Past results are not a guide to future results.