
The method used to find possible investment choices joins a strict technical structure with attention to fundamental growth momentum. This process is modeled on the orderly stock picking system of famous trader Mark Minervini, which highlights purchasing into strength by finding stocks in clear, strong upward trends. The plan first uses Minervini's Trend Template, a group of fixed technical rules made to sort for stocks showing better relative strength and matching momentum across several time periods. To this technical base, a step of fundamental filtering is included, looking for companies showing high growth momentum (HGM). This two-part filter tries to separate securities that are not only technically ready to continue but are also supported by speeding up business basics, forming a combination of elements that often come before major price increases.
A Technical Picture Matching Leadership
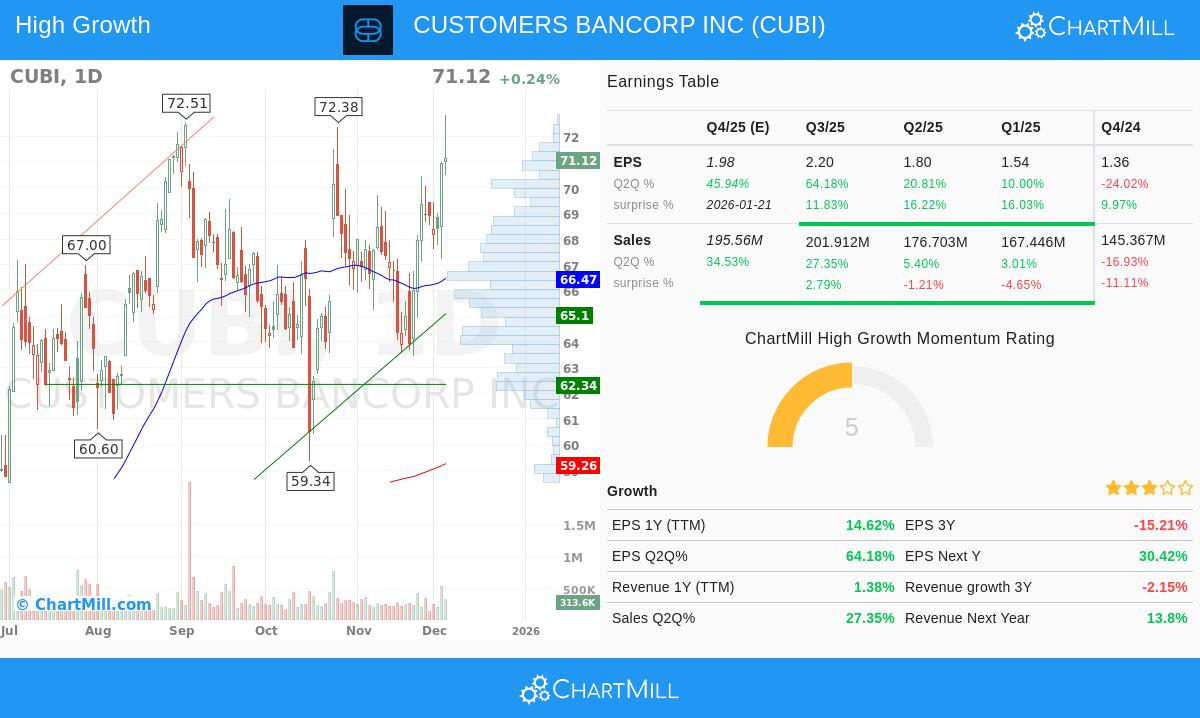
Customers Bancorp Inc (NYSE:CUBI) shows a strong example of a stock that fits the strict needs of the Minervini Trend Template. The template's main goal is to make sure an investor is only involved in stocks where the trend is clearly positive and institutional buying is visible.
A look at CUBI's price movement shows a clear match with these technical rules:
- Trend Match: The stock is trading above all its important simple moving averages (SMAs), the 50-day ($66.47), 150-day ($62.52), and 200-day ($59.26). Also, these averages are in the correct bullish order, with the shorter 50-day SMA above the longer 150-day and 200-day SMAs.
- Nearness to Highs: CUBI's present price of $71.12 is within 2.3% of its 52-week high of $72.83, meeting the "within 25% of the high" rule. At the same time, it is about 75% above its 52-week low of $40.75, well beyond the "30% above the low" rule. This shows strong recovery momentum and placement near a point of possible breakout.
- Better Relative Strength: With a ChartMill Relative Strength (CRS) score of 82.72, CUBI is doing better than over 82% of all stocks in the market and 84% of its group in the Banks industry. High relative strength is a central part of the Minervini idea, as it finds market leaders that often draw continued institutional money.
This technical view indicates CUBI is in a clear Stage 2 advance, the exact stage where Minervini's plan looks to place money.
Fundamentals Backing the Momentum
While the chart shows where to buy, fundamental growth momentum helps explain why the stock is strong. CUBI's recent financial results point to speeding up business patterns that can act as a reason for more price movement, a main part of Minervini's Specific Entry Point Analysis (SEPA).
The high growth momentum is shown by several important measures:
- Earnings Speed Increase: The newest quarter shows large year-over-year EPS growth of 64.2%, a major speed increase from the 20.8% growth in the quarter before. This pattern of getting better quarterly growth rates is a clear sign of positive momentum change.
- Steady Earnings Surprises: The company has topped analyst EPS guesses in each of the last four quarters, with an average beat of 13.5%. This steady better performance builds trust with investors and can lead to higher guesses for future results.
- Strong Profit Margin Growth: Maybe most noticeably, the company's profit margin has grown quickly in the latest quarter to 31.8%, up from 27.1% in the quarter before and only 6.7% two quarters ago. This fast growth in profitability is a strong reason for earnings increase and shareholder value.
- Positive Estimate Changes: Analysts have been increasing their forecasts, with the average EPS guess for the next year going up by 1.66% over the past three months. Upward changes often come before more institutional buying.
Technical Condition and Setup Evaluation
ChartMill's own analysis gives a measured summary of CUBI's technical position. The stock gets a high Technical Rating of 9 out of 10, showing its strong positive trends across both short and long-term periods and its leader status inside the financial group. The report states the stock is trading near a new 52-week high, a strong sign, and confirms the bullish match of its moving averages.
However, the Setup Quality Rating is now a 5. This shows that while the stock's basic technical condition is very good, its recent price movement has been somewhat changeable, making the finding of an exact, low-risk entry point more difficult at this exact moment. The analysis proposes waiting for a time of settling or a move back toward support levels, like the area between $66.47 and $68.39, could give a better risk/reward setup for new entries. A complete list of the support and resistance levels, with the full technical analysis, is in the ChartMill Technical Report for CUBI.
Finding Like Chances
CUBI is a model of the kind of security that comes from a strict filtering process aiming at high growth momentum inside a strong technical trend. For investors looking to use this method to find more choices, the set screen that found CUBI is ready for use. You can look at the present market for similar setups by using the High Growth Momentum + Trend Template screen on ChartMill.
Disclaimer: This article is for information and learning only. It is not investment advice, a suggestion, or an offer to buy or sell any security. The analysis is based on data thought to be correct, but its accuracy cannot be sure. Investing has risk, including the possible loss of the main amount. Always do your own research and think about talking with a qualified financial advisor before making any investment choices.