
For investors looking to find stocks ready for their next rise, a frequent technical method centers on securities that are in solid, clear uptrends and are now trading in a narrow band. This tactic seeks to take part in momentum by starting a position as the stock moves above its consolidation period. A useful way to apply this is by searching for stocks with strong scores for both their general technical condition and the state of their present price formation. This process selects leading market performers that are in a short rest, possibly giving a good balance of risk and reward as a starting point for the expected trend resumption.
CareTrust REIT Inc (NYSE:CTRE) recently appeared from such a search, presenting an interesting case for technical investors. The real estate investment trust, which owns healthcare-related properties, shows a notable mix of trend force and an organized price formation that frequently comes before a large price change.
Technical Strength: The Basis of the Trend
The main requirement in a breakout plan is finding stocks with sound basic technicals. A stock needs to be in a definite uptrend to support a bullish breakout view. For CTRE, the signs of force are clear.
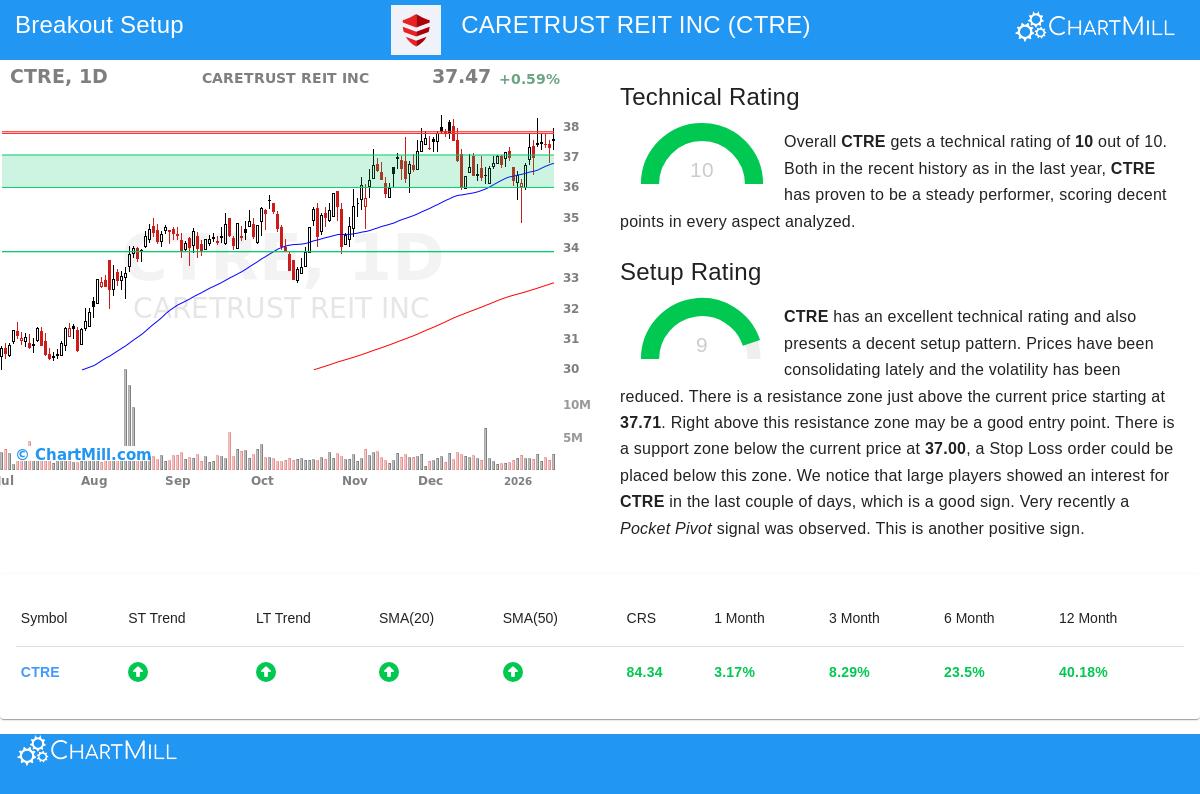
A detailed technical report gives CTRE a top Technical Rating of 10 out of 10. This highest score rests on several important parts:
- Trend Direction: Both the recent and longer-term trends for CTRE are scored as positive. This agreement across different periods is a solid sign of continued buyer interest and lowers the chance of a misleading signal.
- Market and Industry Performance: The stock is doing better than 84% of the wider market over the last year. More notably, inside the Diversified REITs field, it performs better than 91% of its 126 competitors, confirming its place as a top performer in its sector.
- Moving Average Position: The stock is priced above all its main moving averages (20, 50, 100, and 200-day), and each of these averages is also in a rising pattern. This forms a tiered base of support below the price.
- Nearness to Highs: CTRE is trading close to its 52-week high of $38.32, a common trait of stocks in strong uptrends that are building force for a possible breakout.
This outstanding technical rating speaks to the "which stock" question for investors. It verifies CTRE is not a temporary recovery but a participant in a fundamentally sound trend, making it a fitting choice for a momentum-focused plan.
Setup Quality: Finding the Entry Area
A solid trend by itself is not a signal to buy; starting a position in a stock that has risen far can lead to quick declines. The second vital requirement is the Setup Quality rating, which measures if the stock is making a useful consolidation formation. CTRE does very well here too, with a Setup Rating of 9.
This high score shows the stock has been trading in a specific range, lowering instability and setting clear points for entry and stop-loss orders. The technical report points out several elements adding to this good setup:
- Recent Narrow Trading: Over the last month, CTRE has traded between $34.74 and $38.23. While this band is called "quite wide," the price is currently trading in a tight pattern near the top, hinting at a collection of energy.
- Clear Resistance and Support: The analysis finds a specific resistance area between $37.71 and $37.77. A clear move above this area could indicate the beginning of the next trend rise. On the other side, a firm support area exists between $35.93 and $37.00, giving a reasonable place to set a protective stop loss.
- Confirming Signs: The report mentions recent activity from large investors (tracked by Effective Volume) and the presence of a "Pocket Pivot" signal, a price and volume formation often linked to institutional buying. These are seen as good confirmations inside the setup.
This setup examination answers the "when" question for traders. It proposes a possible plan of setting a buy order just above the noted resistance (for example, at $37.78) with a stop loss just below the main support area (for example, at $35.92). This sets the trade's risk from the start, a key part of careful technical trading.
Conclusion and View
The mix of a top Technical Rating (10) and a very high Setup Rating (9) puts CareTrust REIT in a small set of stocks that satisfy strict technical breakout conditions. The stock shows clear market leadership, a firm uptrend across multiple time periods, and is currently tightening in a consolidation formation with clear limits. For investors using this approach, CTRE stands as a classic case of a security that has completed the "hard work" of setting a trend and is now possibly preparing for its next move higher.
It is vital to recall that technical formations show likelihoods, not guarantees. A breakout above resistance needs to be confirmed with trading volume, and any trade should always use a stop-loss order to control risk, particularly with the stock trading near its annual high.
Interested in finding more possible breakout candidates like CTRE? You can perform the same search using our Technical Breakout Setups tool to see a new list of stocks that qualify each day.
,
Disclaimer: This article is for informational and educational purposes only and does not form a recommendation to buy, sell, or hold any security. The analysis is based on technical indicators and past data, which are not assurances of future results. Investing includes risk, including the possible loss of principal. Always do your own research and think about your financial position and risk tolerance before making any investment decisions.