
For technical investors aiming to find stocks ready for their next rise, a common method uses two main parts: a solid core trend and a positive consolidation pattern. The aim is to locate market leaders that are resting to gather strength before a possible breakout. This method can be organized by searching for stocks with high marks in both technical condition and pattern quality, as measured by specialized tools like those from ChartMill. The concept is simple: first, verify the stock is in a solid uptrend; second, check it is trading in a narrow band, giving a defined and lower-risk entry point for when speed picks up again.
A recent scan using this approach has identified CareTrust REIT Inc (NYSE:CTRE) as a pick displaying these traits. The healthcare-centered real estate investment trust shows a positive technical picture that deserves further examination for those monitoring breakout methods.
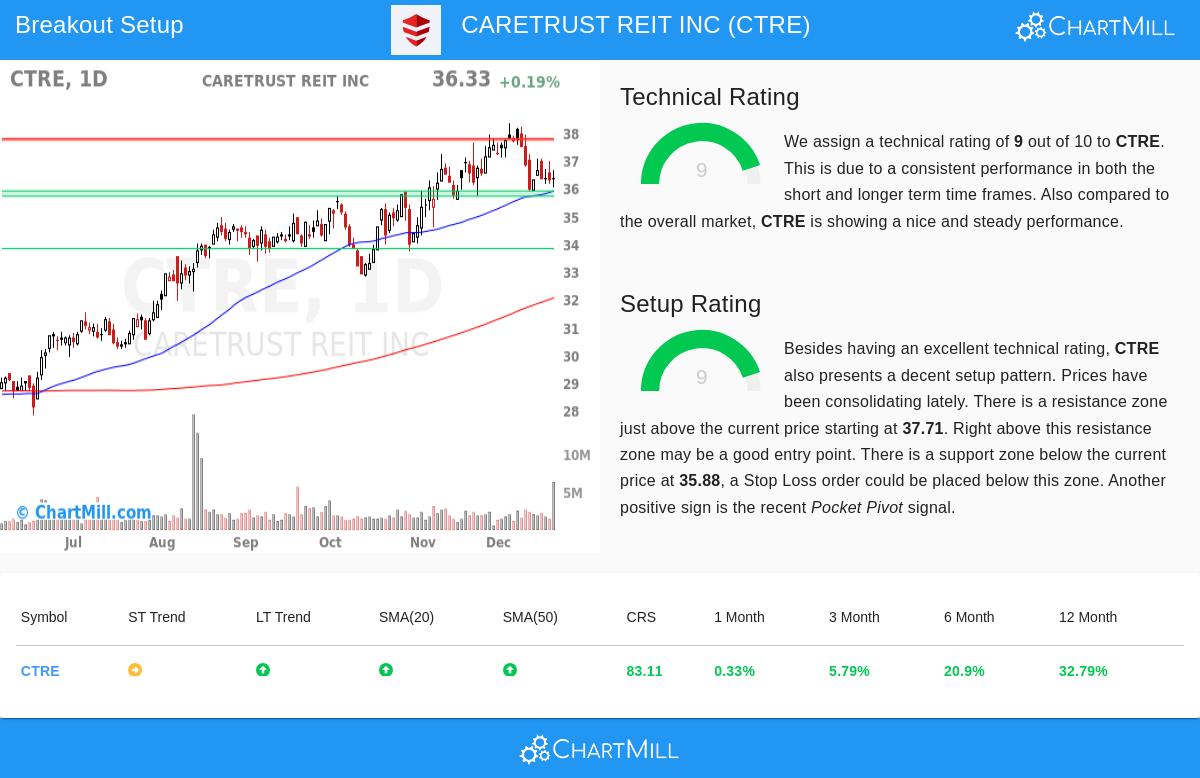
Reviewing the Technical Base
The main requirement for any breakout pick is a solid and confirmed uptrend, which points to institutional backing and favorable momentum. CareTrust REIT’s technical base seems firm, receiving a leading Technical Rating of 9 out of 10 from ChartMill. This grade measures the stock's overall technical condition over several periods.
An examination of the full technical report shows the reasons for this high grade:
- Trend Condition: The long-term trend is decidedly positive, while the short-term trend is now neutral. This mix frequently signals a healthy rest inside a bigger uptrend.
- Relative Performance: The stock has done much better than similar companies and the overall market. Over the last year, CTRE has performed better than 83% of all stocks and beats 89% of other firms in the Diversified REITs field.
- Moving Average Position: A main indicator of a sound trend is when shorter-term averages are priced above longer-term ones. CTRE’s price is above its rising 20, 50, 100, and 200-day simple moving averages, showing continued buying interest across all checked periods.
This solid technical background is vital for the method because it raises the chance that any breakout from consolidation will keep going in the direction of the existing trend, instead of stalling or turning down.
Reviewing the Pattern Quality
A solid trend by itself is not a buy signal; entering during a steep climb holds high risk. The second essential part is spotting a sound pattern—a time of consolidation that gives a defined entry and a reasonable spot for a protective stop-loss order. CTRE does well here too, having a Setup Quality Rating of 9.
The technical report explains the pattern forming, which matches what breakout traders search for:
- Consolidation Area: The stock has been trading in a set band between about $35.74 and $38.32 over the last month. It is now trading near the bottom of this band, which might be forming a base for an upward move.
- Defined Support and Resistance: The pattern gives clear reference levels. An important support area is found between $35.69 and $35.88, made by a combination of moving averages and trendlines. Just above the present price, a resistance area lies between $37.71 and $37.77.
- Positive Activity: A recent "Pocket Pivot" signal—a price increase on higher volume than the weakest down volume day in the previous ten sessions—hints that buying may be happening, another good indicator for the pattern.
For a trader, this framework allows for a planned approach: a buy order could be set just above the noted resistance area, confirming a breakout, with a stop-loss order placed just below the support area to control risk. The automatic review proposes a possible entry at $36.62 with an exit at $35.82, though traders would modify these levels based on their own risk limits.
Final Points and Following Actions
CareTrust REIT offers an example of the breakout scanning idea: a stock with clear long-term condition taking a pause in a well-marked band. The high Technical Rating confirms its leading position, while the high Setup Rating identifies a possible turning point. While prior results are not a certainty, this mix of elements is what technical investors frequently search for when looking for new possibilities.
It is key to recall that CTRE is only one instance from today's market scan. Breakout patterns are active, and new picks appear often as price shapes form. For investors wanting to see the present list of stocks fitting similar standards for solid technicals and sound patterns, you can view the live results from the Technical Breakout Setups scan.
Disclaimer: This article is for information only and is not investment advice, a suggestion, or an offer to buy or sell any security. The review uses technical data and automatic scoring models, which can change. All investing and trading has risk, including the possible loss of principal. Always do your own research, think about your financial position and risk comfort, and talk with a qualified financial advisor before making any investment choices. The trade pattern noted is an automatic example for illustration and should not be seen as a specific suggestion.