
Growth investors are on the lookout for stocks displaying robust revenue and EPS growth. In this analysis, we'll assess whether CARETRUST REIT INC (NYSE:CTRE) aligns with growth investing criteria, especially as it consolidates and signals a possible breakout. As always, investors should conduct their own research, but CARETRUST REIT INC has surfaced on our radar for growth with base formation, warranting further examination.
Assessing Growth Metrics for CTRE
To evaluate a stock's growth potential, ChartMill utilizes a Growth Rating on a scale of 0 to 10. This comprehensive assessment considers various growth aspects, including historical and estimated EPS and revenue growth. CTRE has achieved a 9 out of 10:
- CTRE shows a strong growth in Earnings Per Share. In the last year, the EPS has been growing by 70.83%, which is quite impressive.
- Measured over the past years, CTRE shows a quite strong growth in Earnings Per Share. The EPS has been growing by 11.30% on average per year.
- The Revenue has grown by 36.05% in the past year. This is a very strong growth!
- The Revenue has been growing by 12.64% on average over the past years. This is quite good.
- CTRE is expected to show a strong growth in Earnings Per Share. In the coming years, the EPS will grow by 27.34% yearly.
- CTRE is expected to show a strong growth in Revenue. In the coming years, the Revenue will grow by 23.09% yearly.
- When comparing the EPS growth rate of the last years to the growth rate of the upcoming years, we see that the growth is accelerating.
- The Revenue growth rate is accelerating: in the next years the growth will be better than in the last years.
Looking at the Health
Every stock is evaluated by ChartMill, receiving a Health Rating on a scale of 0 to 10. This assessment considers different health aspects, including liquidity and solvency, both in absolute terms and relative to industry peers. CTRE has achieved a 5 out of 10:
- An Altman-Z score of 6.14 indicates that CTRE is not in any danger for bankruptcy at the moment.
- With an excellent Altman-Z score value of 6.14, CTRE belongs to the best of the industry, outperforming 100.00% of the companies in the same industry.
- CTRE has a Debt/Equity ratio of 0.14. This is a healthy value indicating a solid balance between debt and equity.
- With an excellent Debt to Equity ratio value of 0.14, CTRE belongs to the best of the industry, outperforming 99.23% of the companies in the same industry.
- With a decent Current ratio value of 1.94, CTRE is doing good in the industry, outperforming 76.92% of the companies in the same industry.
- With a decent Quick ratio value of 1.94, CTRE is doing good in the industry, outperforming 76.92% of the companies in the same industry.
Assessing Profitability for CTRE
ChartMill assigns a Profitability Rating to every stock. This score ranges from 0 to 10 and evaluates the different profitability ratios and margins, both absolutely, but also relative to the industry peers. CTRE scores a 8 out of 10:
- CTRE's Return On Assets of 3.63% is amongst the best of the industry. CTRE outperforms 84.62% of its industry peers.
- CTRE's Return On Equity of 4.29% is fine compared to the rest of the industry. CTRE outperforms 67.69% of its industry peers.
- With an excellent Return On Invested Capital value of 4.56%, CTRE belongs to the best of the industry, outperforming 84.62% of the companies in the same industry.
- CTRE had an Average Return On Invested Capital over the past 3 years of 5.24%. This is above the industry average of 3.20%.
- CTRE's Profit Margin of 42.07% is amongst the best of the industry. CTRE outperforms 91.54% of its industry peers.
- In the last couple of years the Profit Margin of CTRE has grown nicely.
- CTRE's Operating Margin of 64.83% is amongst the best of the industry. CTRE outperforms 99.23% of its industry peers.
- CTRE's Operating Margin has improved in the last couple of years.
- Looking at the Gross Margin, with a value of 98.07%, CTRE belongs to the top of the industry, outperforming 98.46% of the companies in the same industry.
Looking at the Setup
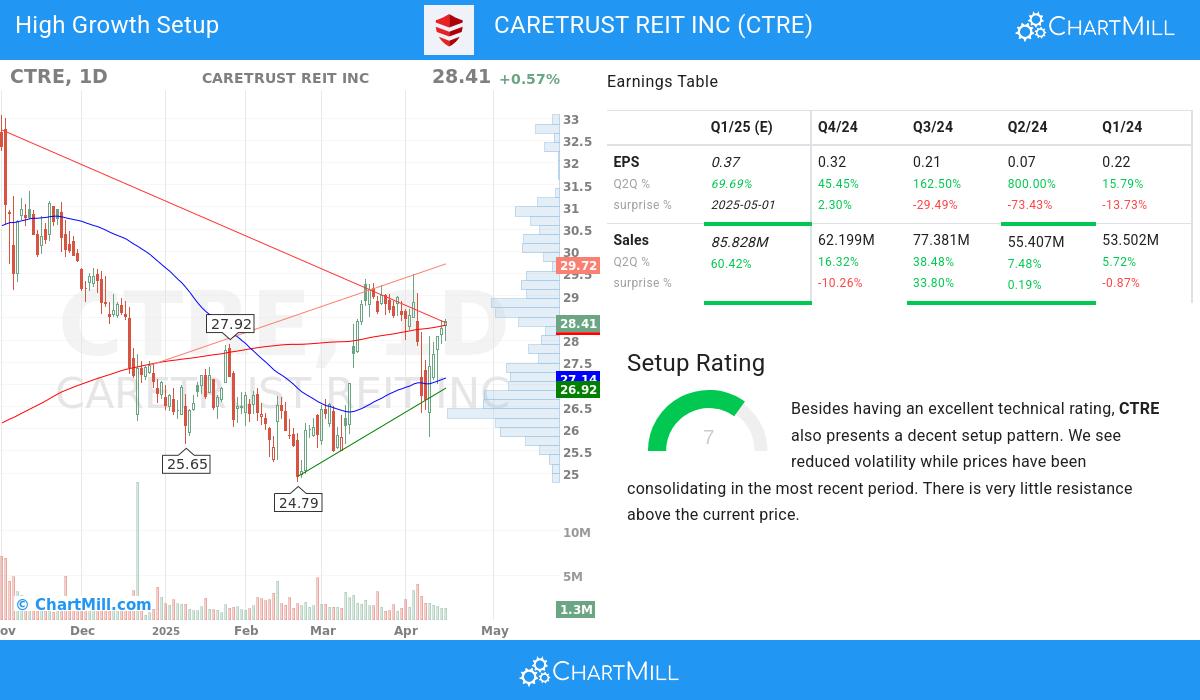
ChartMill also assigns a Setup Rating to each stock. This rating, on a scale of 0 to 10, reflects the degree of consolidation observed based on short-term technical indicators. Currently, CTRE exhibits a 7 setup rating, indicating its consolidation status in recent days and weeks.
CTRE has an excellent technical rating and also presents a decent setup pattern. We see reduced volatility while prices have been consolidating in the most recent period. There is very little resistance above the current price.
Every day, new Strong Growth stocks can be found on ChartMill in our Strong Growth screener.
For an up to date full fundamental analysis you can check the fundamental report of CTRE
Check the latest full technical report of CTRE for a complete technical analysis.
Keep in mind
This article should in no way be interpreted as advice. The article is based on the observed metrics at the time of writing, but you should always make your own analysis and trade or invest at your own responsibility.