
Investors often seek to balance the potential for significant capital appreciation with a disciplined approach to managing risk. One method that attempts to achieve this is by combining strong fundamental growth characteristics with favorable technical chart patterns. The underlying strategy is to identify companies that are not only increasing their earnings and revenue at an above-average pace but are also on the edge of a potential price breakout, as suggested by their stock chart. This dual analysis aims to find opportunities where improving business fundamentals may be meeting a shift in market sentiment, possibly signaling the start of a new upward trend.
COTERRA ENERGY INC (NYSE:CTRA) presents a case study for this combined approach. As a diversified energy company with operations across key U.S. basins like the Permian, Marcellus, and Anadarko, Coterra has placed itself to benefit from domestic oil and natural gas production. The company's recent fundamental and technical data suggest it may fit the profile of a solid growth stock displaying a favorable technical configuration.
Fundamental Growth Strength
The center of the growth investing thesis rests on a company's ability to increase its business at a quickening rate. According to ChartMill's fundamental analysis report, Coterra receives a solid Growth Rating of 8 out of 10, placing it with the better performers in its industry. This score is supported by concrete financial metrics:
- Notable Recent Growth: Over the past year, the company reported a 26.74% growth in Earnings Per Share (EPS) and a 25.13% increase in Revenue, demonstrating strong near-term business momentum.
- Firm Long-Term Trajectory: Looking back five years, Revenue has grown at an average yearly rate of over 21%, confirming a maintained expansion trend.
- Positive Future Outlook: Analysts project this growth to continue, with expected yearly EPS growth of nearly 17% and Revenue growth of about 16% in the coming years.
For a growth-focused strategy, these figures are critical. They show that the company is not only a cyclical beneficiary but is performing in a way that creates steady and projected increase in both sales and profitability, a key qualitative condition for lasting growth.
Attractive Valuation Amid Growth
A common trap in growth investing is paying a too high premium for future potential. Coterra’s valuation metrics suggest this may not be the case. The company’s Valuation Rating is a high 8/10, forming a noteworthy and attractive mix of growth and value.
- The stock trades at a Price-to-Earnings (P/E) ratio of 11.66 and a Forward P/E of 8.70, which are viewed as reasonable and are less expensive than about 74% and 83% of its industry peers, respectively.
- Both ratios are also notably below the current averages for the S&P 500, suggesting the market may not be completely valuing the company’s growth path.
This valuation context is important for the overall method because it provides a margin of safety. It means the stock’s growth story is not reliant on multiple expansion alone; further price increase could be driven simply by earnings growth even if the P/E ratio stays the same.
Supporting Fundamentals: Profitability and Financial Health
For growth to be lasting, a company must be profitable and financially stable. Coterra’s fundamental report shows a Profitability Rating of 7/10, highlighting efficient operations.
- The company displays strong margins, including a Gross Margin of 82.81% and an Operating Margin of 31.31%, which do better than a large portion of its competitors in the Oil, Gas & Consumable Fuels sector.
- Its Return on Invested Capital (ROIC) of 7.86% also exceeds most industry peers.
The Financial Health Rating is a moderate 5/10. While the company keeps a sound Debt-to-Equity ratio of 0.25 and a firm Debt-to-Free-Cash-Flow ratio, indicating good solvency, investors should note the relatively low Quick Ratio (0.98), which points to some near-term liquidity factors. In the context of a growth strategy, acceptable health and solid profitability give confidence that the company has the operational capacity to finance its growth plans.
Technical Configuration for a Potential Breakout
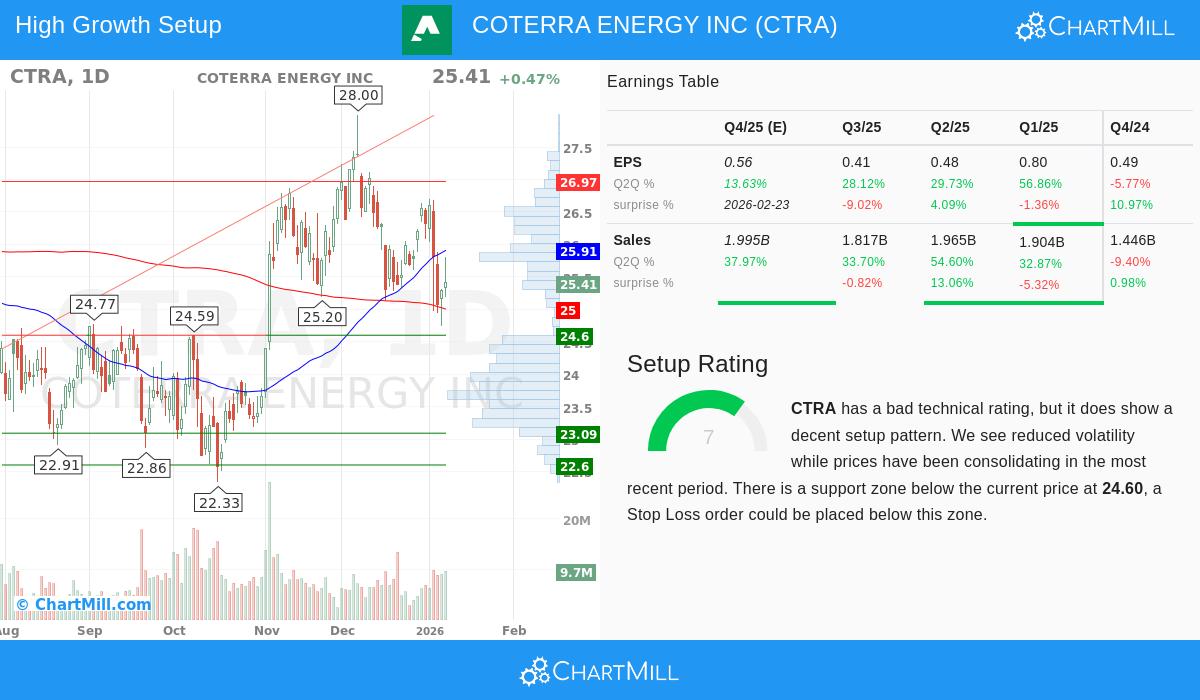
While fundamentals describe the "why," technical analysis can help identify the "when." According to ChartMill's technical analysis report, CTRA currently presents a notable setup, receiving a Setup Rating of 7 out of 10 despite a lower overall technical score.
- The stock has been moving in a range between about $24.74 and $27.11 over the past month, with volatility decreasing, a pattern that frequently comes before a meaningful price move.
- A defined support zone is found around $24.60, providing a sensible level for a stop-loss order to handle risk.
- The immediate resistance lies in the $25.60 to $25.92 zone, which is made by a mix of trend lines and key moving averages. A clear break above this resistance on high volume could signal the start of a new positive phase and confirm the growth thesis from a price-action viewpoint.
This technical context is key for the combined strategy. It aims to time an entry not during a time of falling prices, but as the stock gathers energy and shows indications of surpassing selling pressure, possibly aligning the investment with a new wave of buying momentum.
Conclusion
Coterra Energy Inc. illustrates the type of opportunity looked for by strategies that join fundamental and technical analysis. The company shows strong, measurable growth in earnings and sales, trades at a valuation that does not seem excessive, and operates with solid profitability. At the same time, its stock chart shows a consolidation pattern near a set support level, suggesting a potential breakout may be forming. This meeting suggests the market may be starting to acknowledge the fundamental story.
For investors interested in finding other stocks that fit this profile of solid growth paired with favorable technical configurations, you can examine the predefined screen here.
Disclaimer: This article is for informational purposes only and does not constitute financial advice, a recommendation, or an offer to buy or sell any security. Investing involves risk, including the potential loss of principal. You should conduct your own research and consult with a qualified financial advisor before making any investment decisions.