
Combining technical and fundamental analysis gives investors a complete way to find possible opportunities in the equity markets. This method tries to match companies showing solid underlying business performance—such as good growth, profitability, and financial condition—with positive chart patterns that indicate a possible upward price move. By concentrating on securities that show both fundamental quality and technical momentum, investors try to find stocks ready for a price increase, mixing quantitative business measures with market timing factors.
COTERRA ENERGY INC (NYSE:CTRA) appears as a significant candidate from a screen made to find good growth stocks with positive technical formations. This energy company, with operations in important U.S. basins, displays a mix of improving operational results and constructive price activity, making it a noteworthy example for this investment method.
Fundamental Strengths Supporting Growth
From a fundamental viewpoint, Coterra Energy shows several traits common in a growth-focused company. The firm’s revenue has increased notably, with a one-year growth rate of 17.10% and a strong 21.44% average yearly growth over recent years. Earnings are also forecast to improve, with analysts expecting a 14.42% average yearly growth in EPS going forward. These numbers show the company is not only expanding but is predicted to keep doing so—an important factor for growth investors who value future increase over current income.
Further supporting its growth profile, Coterra’s valuation seems appealing compared to its industry and the wider market. With a P/E ratio of 11.41 and a forward P/E of 6.92, the stock is valued lower than many similar companies and the S&P 500 average. This mix of solid growth and fair valuation can frequently point to opportunity, as it implies the market may not yet be completely valuing the company’s growth possibility.
Other fundamental points include:
- A profitability rating of 7/10, showing good margins and returns on capital
- A growth rating of 7/10, pointing to healthy past and expected expansion
- A financial health rating of 5/10, indicating acceptable—though not outstanding—balance sheet condition
For a complete summary of these measures, readers can see the full fundamental analysis report.
Technical Setup Indicating Potential Breakout
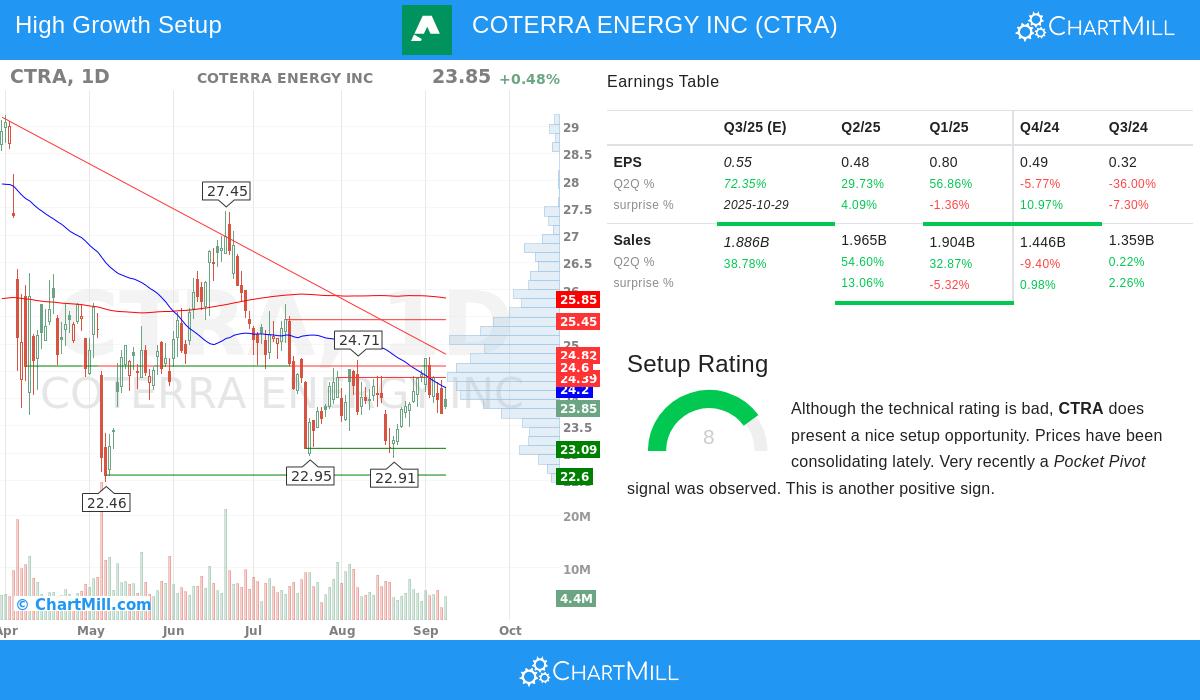
On the technical side, Coterra shows an interesting formation even with a varied longer-term trend. The stock has been moving within a set range between about $22.91 and $24.77 over the last month, displaying signals of leveling after a time of lower performance. This kind of price activity often comes before a notable move, as consolidation can show a balance between buyers and sellers before a new trend begins.
Importantly, a recent pocket pivot signal has been seen—a technical formation that happens when a stock moves up on higher volume than the highest down volume over the previous ten days. This is often viewed as a sign of buying and can act as a forerunner to a positive breakout. Even though the long-term trend is still negative, the short-term trend has become neutral, and the appearance of this pattern during consolidation adds a layer of positive technical evidence.
Key technical notes include:
- Trading in the middle of its recent range, possibly giving a positive risk/reward entry point
- A setup rating of 8/10, showing a favorable technical formation despite the stock’s softer performance over the past year
- Set support near $23.68 and resistance around $24.82, giving clear levels for watching price movement
The full technical analysis report provides more context and charts for those wanting more information.
Why These Criteria Matter
The combination of fundamental and technical analysis is key to the strategy used to find Coterra. Good growth measures make sure the company has the operational momentum to justify higher valuations, while a positive technical formation suggests market players may be starting to see this possibility. This double confirmation helps remove companies that might be fundamentally healthy but do not have near-term catalytic price activity—or on the other hand, those with interesting charts but poor business outlooks.
In Coterra’s case, the growth in revenue and earnings highlights the company’s capacity to benefit from opportunities in the energy sector, especially through its varied asset base in the Permian, Marcellus, and Anadarko basins. When this fundamental story is combined with a technical formation that suggests growing buyer interest, the stock fits well with a growth-and-momentum plan.
Exploring Similar Opportunities
Coterra is only one instance of how mixing growth fundamentals with technical timing can reveal possible opportunities. Investors curious about seeing other stocks that fit similar standards can look at more results using the Strong Growth Stocks with Good Technical Setup Ratings screen. This screen changes based on current market data, providing a useful tool for continuous research.
Conclusion
COTERRA ENERGY INC presents a noteworthy case study in the meeting of fundamental growth and technical placement. With increasing revenue, a reasonable valuation, and developing signals of positive momentum, the stock demonstrates the kind of opportunity sought by strategies that join quantitative business study with chart-based timing. While market conditions and sector forces will certainly affect its path, CTRA gives a real example of how disciplined, multi-factor study can find interesting candidates in the current market setting.
Disclaimer: This article is for informational purposes only and does not constitute investment advice or a recommendation to buy, sell, or hold any security. Investing involves risks, including the potential loss of principal. Readers should conduct their own research and consult with a qualified financial advisor before making investment decisions.