
For investors looking to find potential breakout chances, joining technical strength with consolidation patterns often gives a systematic method for market entry. The process includes scanning for stocks that have both high technical ratings, pointing to strong existing momentum, and high setup quality scores, indicating the stock is settling before a possible price change. This two-part filter method helps find technically good companies that might be ready for their next upward move, possibly presenting acceptable risk-reward situations.
Technical Strength Assessment
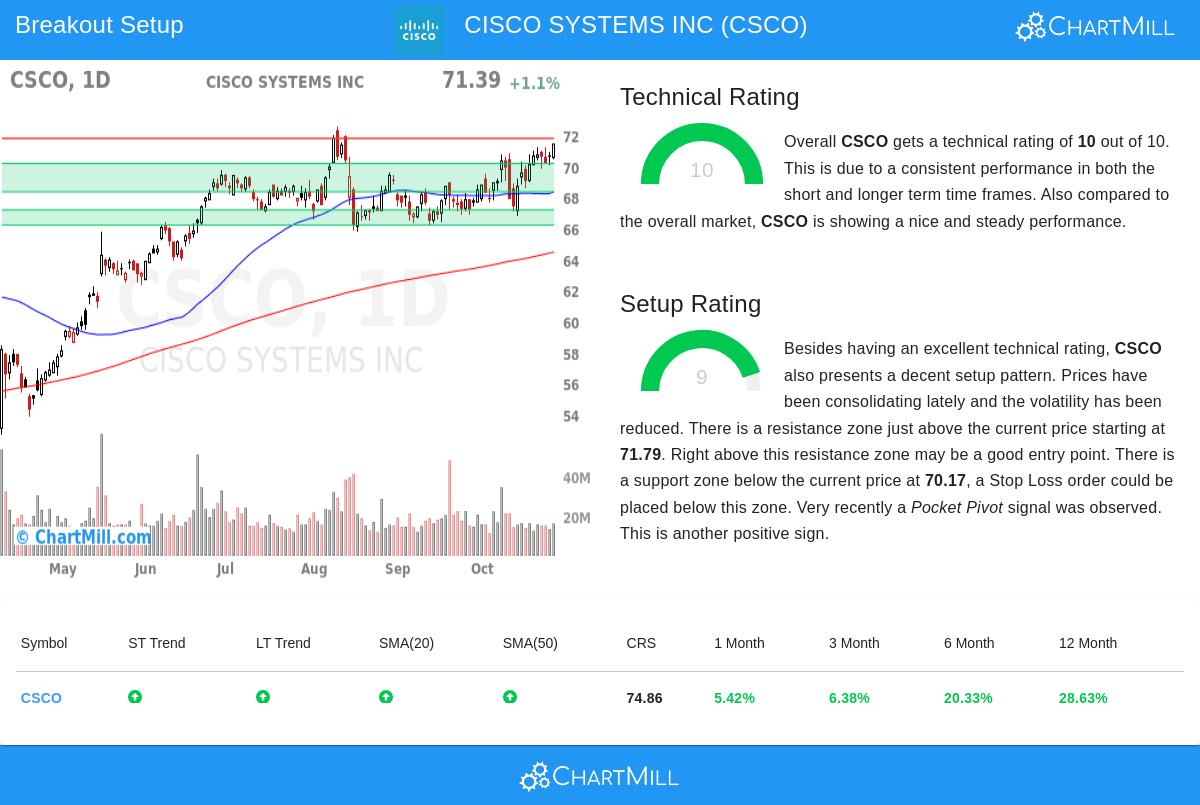
CISCO SYSTEMS INC (NASDAQ:CSCO) shows very good technical condition, getting a top technical rating of 10 out of 10 from the ChartMill technical analysis report. This highest mark shows wide strength over several technical areas that are important for finding leading stocks.
Important technical points include:
- Both long-term and short-term trends are clearly positive
- The stock is priced above all its main moving averages (20-day, 50-day, 100-day, and 200-day)
- Good relative strength, doing better than 74% of all stocks in the last year
- Present trading near its 52-week high matches with wider market health
The technical rating's value is in how it finds market leaders with continued upward momentum. Stocks getting the highest marks usually display steady results over different timeframes and technical measures, lowering the chance of false breakouts and giving a good base for possible continued health.
Setup Quality and Consolidation Pattern
Besides technical strength, CSCO has a very good setup quality rating of 9 out of 10, showing the stock has been moving in a set range. This settling stage is exactly what technical investors search for when finding possible breakout candidates.
Notable setup features:
- Recent trading span between $66.81 and $71.46 shows clear edges
- Lowered volatility during the settling time
- Clear resistance area found near $71.79
- Several support levels under the present price, with main support at $70.17
- Recent pocket pivot signal showing institutional buying
The setup quality rating's importance comes from how it finds times when a stock is preparing for its next action. High setup marks usually happen when stocks trade in narrow spans after past gains, letting investors set clear entry points above resistance and stop-loss points under support.
Trading Considerations
The mix of top technical condition and high setup quality makes an interesting situation for technical investors. The proposed trading method involves getting in above the $71.79 resistance point with a stop-loss under the $70.17 support area. This gives set risk measures of about 5 points or 6.96%, allowing for exact position sizing based on personal risk comfort.
While the technical situation looks good, investors should think about:
- The wider market situation, with both short-term and long-term S&P 500 trends staying positive
- Coming earnings reports or company-specific events
- General market states that could influence technology stocks
- Personal risk comfort and investment period
For investors looking for similar technical breakout chances, more scanning results are available using the Technical Breakout Setups screen, which often finds stocks matching these technical and setup rules.
Disclaimer: This analysis is based on technical indicators and should not be considered investment advice. Always conduct your own research, consider your financial situation, and consult with a financial advisor before making investment decisions. Past performance does not guarantee future results, and all trading involves risk including the potential loss of principal.