
For investors aiming to find stocks ready for their next rise, a systematic method joining trend force with entry timing is important. One such plan involves looking for stocks that show both sound technical condition and a helpful consolidation shape, pointing to a possible breakout. This method, as explained in ChartMill's system, uses two proprietary scores: the Technical Rating, which measures a stock's total trend force, and the Setup Quality Rating, which judges the condition of its present price consolidation. By concentrating on securities that rate highly on both measures, investors can find market leaders that are not only in solid uptrends but are also giving a lower-risk entry point after a time of steadiness.
A recent scan using this breakout system has pointed to CRH PLC (NYSE:CRH) as a notable candidate. The global building materials leader, which makes and distributes products for building projects globally, is now showing a chart pattern that fits with the plan's main ideas.
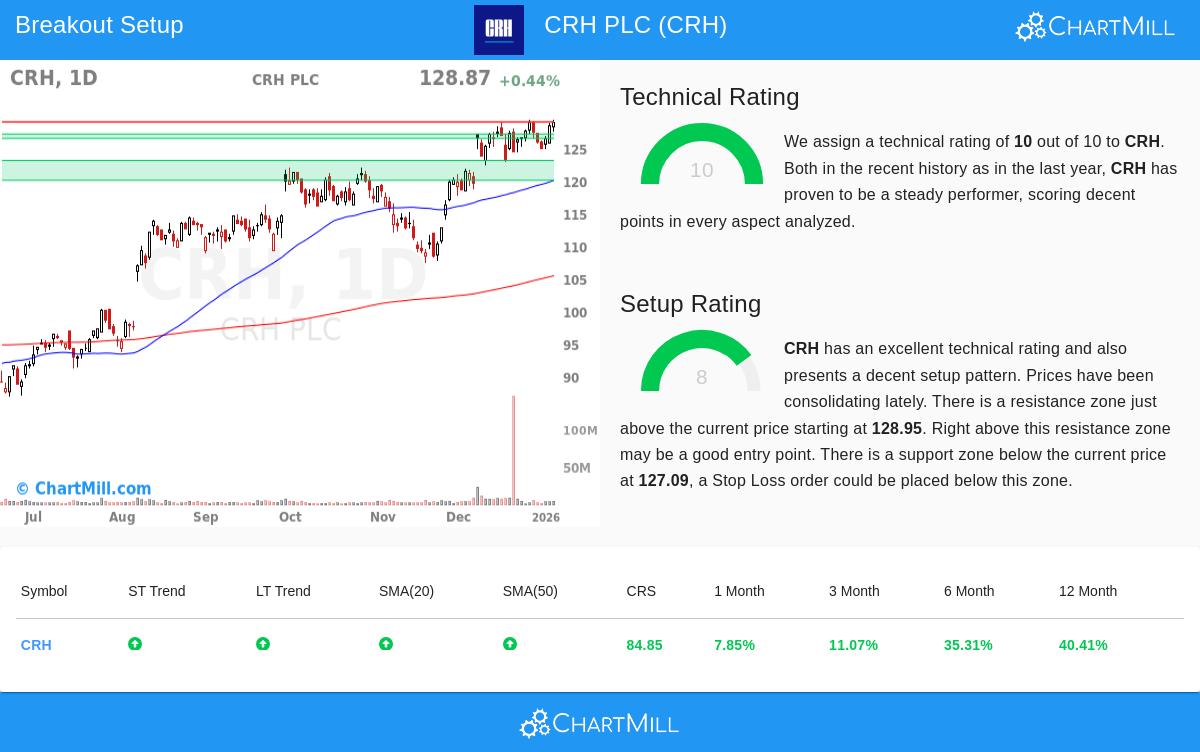
Technical Force: A Base of Momentum
The main filter in a breakout search looks for stocks with a high Technical Rating, making sure the basic trend is forceful and lasting. CRH does very well here, having a perfect Technical Rating of 10. This highest score shows outstanding technical condition across many timeframes and measures, a full account of which is found in the full technical report.
The force is clear in all areas:
- Trend Agreement: Both the long-term and short-term trends are rated as positive, showing agreed momentum without opposite signals.
- Price vs. Moving Averages: The stock price is trading well above all main simple moving averages (20, 50, 100, and 200-day), with each average itself in a rising setup. This layered agreement of support levels is a standard sign of a solid uptrend.
- Relative Performance: CRH is doing better than 84% of all stocks in the market over the last year and 83% of its group in the Construction Materials industry. It is also trading near its 52-week high, confirming its leader position.
This sound technical background is important for the breakout plan because it raises the chance that any move higher from a consolidation will be a continuation of the set trend, instead of a short counter-trend rally.
Setup Condition: The Consolidation Before the Move
A solid trend alone is not a signal to buy; entering after a sharp, long run can be risky. This is where the Setup Quality Rating becomes key. It finds times of consolidation where volatility lessens and the stock forms a base, giving a clearer area for setting risk. CRH shows a Setup Rating of 8, meaning a high-condition consolidation pattern has formed.
Main features of this setup contain:
- Narrow Trading Range: Over the last month, CRH has traded in a set range between about $122.27 and $129.28. This coiling action after a solid earlier gain is common before a breakout.
- Nearness to Main Levels: The present price is floating near the top of this range, close to a set resistance area around $128.95. A clear move above this level could signal the start of the next upward part.
- Clear Risk Setting: The consolidation has made a nearby support area, with the most immediate level around $127.09. This gives a sensible area below which a stop-loss order could be set, defining the trade's maximum risk from the start.
The existence of this high-condition setup is what changes CRH from a simply strong stock into a possible breakout candidate. It suggests the stock is pausing, letting moving averages catch up and setting the scene for a possible clear move.
A Possible Trading Situation
Based on the study of support and resistance, a specific, though only for example, setup appears. The found resistance area starts at $128.95. A breakout above this level could be used as an entry signal. On the other hand, the nearby support area gives a sensible exit point for a stop-loss order just below $126.41. This structure makes a trade with a set, fairly narrow risk measure, which is a main part of disciplined technical trading.
Disclaimer: This study is based on a technical search system and chart patterns. It is for information only and should not be seen as investment advice, a suggestion to buy or sell any security, or a promise of future results. Always do your own full research, think about your personal risk comfort, and know company-specific basics and news, like coming earnings reports, before making any investment choices. The given trade situation is an automatic example for learning; real entry, exit, and position size should be set by your personal trading plan.
For investors wanting to find other stocks now meeting these technical breakout rules, new candidates are found each day. You can see the present list of possible setups by going to the Technical Breakout Setups screen.