
Investors looking to join the possibility of high-growth companies with the exactness of timing from chart study frequently use a method that filters for solid growth stocks showing positive technical breakout formations. This method tries to find companies with sound basic business qualities, specifically, speeding up earnings and sales growth, firm profitability, and a good financial position, that are also near a possible price increase as shown by their price charts. The reasoning is simple: basic strength gives the long-term belief, while a chart formation gives a tactical point to enter, possibly showing that large investor buying or a change in market feeling is happening. One stock now noted by this kind of method is Catalyst Pharmaceuticals Inc (NASDAQ:CPRX).
Basic Strength: The Growth Motor
At its center, this method requires outstanding basic condition, and Catalyst Pharmaceuticals meets this need strongly. The company’s basic analysis report gives it a high total score of 8 out of 10, with high marks in Growth (9), Profitability (9), and Financial Health (8). These three create the perfect base for a growth investment.
Growth Path:
- Past Results: CPRX has shown very fast growth, with Revenue rising by 25.56% over the last year and at a typical yearly speed of 36.89% over recent years. Even more notable, its Earnings Per Share (EPS) grew 45.76% last year.
- Future Outlook: Experts predict this solid speed to keep going, with expected typical yearly EPS growth of 26.80% and Revenue growth of 11.21% going forward.
Profitability and Effectiveness: The company is not only increasing total sales; it is turning that growth into large profits with notable effectiveness.
- It has a Profit Margin of 37.64% and an Operating Margin of 44.78%, putting it in the highest group of its biotechnology industry group.
- Important return measures like Return on Equity (23.65%) and Return on Invested Capital (21.23%) are very good, showing management is using money well to create value for shareholders.
Financial Health: A solid growth story can be stopped by a poor financial statement, but CPRX shows clear strength here.
- The company has no debt, removing interest cost and failure risk.
- It keeps high cash availability, with a Current Ratio of 6.62, making sure it can easily meet near-term needs and pay for continuing work.
This basic picture is key for the method because it finds a company with a shown and expected growth path, the skill to gain from its increase, and the money stability to handle difficulties, all signs of a lasting growth investment.
Chart Formation: The Timing Sign
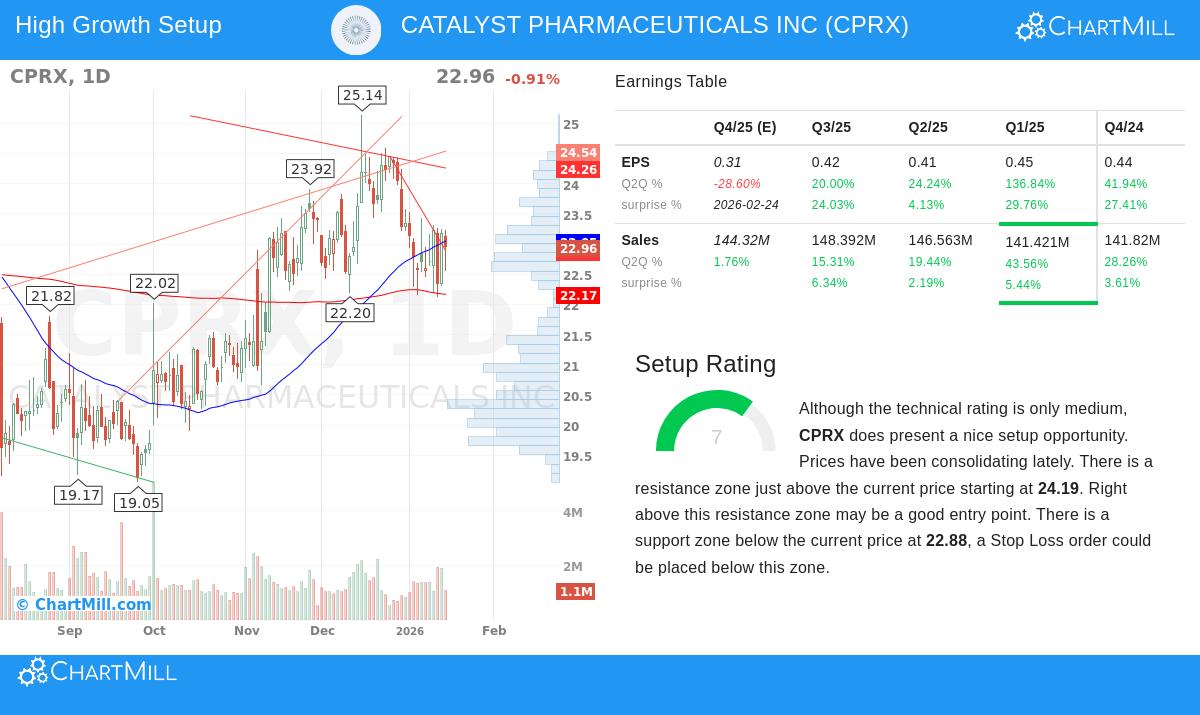
While basics give the "why," chart study hints at the "when." According to its chart analysis report, CPRX shows a Setup Score of 7, pointing to a possibly interesting price chart formation even with a neutral total trend score.
The stock has been moving sideways in an area between about $22.13 and $24.59 over the last month, forming a base after its recent activity. This time of balance often comes before a clear move. The chart report notes a defined resistance area just above the present price, from $24.19 to $24.26. A continued move above this area, especially with more trading volume, could show the end of the sideways phase and the start of a new upward move.
For a growth stock with CPRX’s basic qualities, such a move can be important. It may show the market starting to value its future growth more completely or a flow of new money seeing its value. The method especially searches for these formations in basically sound stocks, as breakouts are thought to be more dependable when they happen in companies with solid earnings speed, not only speculative speed.
Value Setting
Another interesting part of CPRX’s story is its price value. Even with its high growth and profitability scores, the stock seems fairly priced. With a Price/Earnings (P/E) ratio of 13.35 and a Forward P/E of 11.77, it is valued lower than over 96% of its biotechnology industry group and sits much below the present average for the S&P 500. This mix of solid growth, high profitability, and fair value can lower risk of falling and improve the chance for price gain as earnings keep growing.
End
Catalyst Pharmaceuticals Inc shows a case where a strict filtering process finds a company that fits with both growth and tactical entry ideas. Its basic report shows a profitable, financially sound business on a high-growth path in the specialized rare disease market. At the same time, its price chart shows it is tightening near an important resistance level, suggesting a possible breakout may be close. For investors using a method that looks for solid basics supported by chart formations, CPRX deserves more study.
This stock was found using a set filter for Solid Growth Stocks with good Technical Setup Scores. If this method fits your investment style, you can see the filter and look at other present results here.
Disclaimer: This article is for information only and does not make financial advice, a suggestion, or a bid or request to buy or sell any securities. The information given is based on supplied data and should not be the only base for any investment choice. Investing includes risk, including the possible loss of the original amount. Always do your own study and think about talking with a qualified financial advisor before making any investment choices.