
Investors looking for chances in the equity markets often deal with the task of weighing a company's basic business health against its present price direction. One method that tries to combine these two areas is a strategy centered on finding solid growth stocks that are also showing encouraging technical breakout formations. This approach tries to capture companies with good fundamental growth outlooks, such as accelerating earnings and revenue, while timing the purchase to match a phase of positive price movement, indicating the market is starting to see and value those basics. The objective is to locate stocks where the fundamental narrative is strong and the technical view signals that a notable upward price shift could be starting.
Catalyst Pharmaceuticals Inc (NASDAQ:CPRX) works as a relevant case study for this strategy. As a commercial-stage biopharmaceutical company centered on rare diseases, its fundamental background points to a solid growth path, while its recent trading behavior shows a possible technical breakout is developing.
Fundamental Growth Strength
The foundation of this strategy is locating companies with outstanding growth measurements, and Catalyst Pharmaceuticals meets this need. The company's fundamental analysis report gives it a high total score, with its growth part being especially notable. The numerical information shows a company in a solid expansion stage.
- Earnings Per Share (EPS) Growth: The company's EPS increased by a notable 45.76% over the last year, with a 3-year yearly growth rate of 34.29%.
- Revenue Expansion: Revenue rose by 23.49% in the last year, backed by a very good 3-year yearly growth rate of 36.89%.
- Future Expectations: Analysts anticipate this solid performance to persist, with estimated EPS growth averaging 26.50% each year in the next few years.
This good growth is not happening alone; it is supported by very good profitability. The company has a Profit Margin of 37.42% and an Operating Margin of 43.51%, which place it with the better performers in the active biotechnology field. For a growth investing plan, these numbers are important as they show the company is not only increasing its sales but is also very good at turning sales into real profit, a main factor for lasting achievement.
Financial Health and Valuation
A solid growth narrative can be weakened by a poor balance sheet or a too-high price. Luckily, Catalyst Pharmaceuticals also receives high marks in these parts, which lowers investment danger. The company's financial health score is good, marked by a total lack of debt and solid liquidity measures, including a Current Ratio of 6.72. This shows the company has sufficient funds to pay for its current work and future growth projects without the load of interest costs or refinancing danger.
From a price perspective, the stock seems appealing compared to its growth and profitability. Its Price-to-Earnings (P/E) ratio of 13.24 is much lower than the field average and the wider S&P 500. This mix of high growth, high profitability, and a sensible price forms a strong fundamental situation, suggesting the stock could have space for upward price growth as the market keeps valuing its solid potential. You can examine the full details in the detailed fundamental analysis report.
Technical Breakout Setup
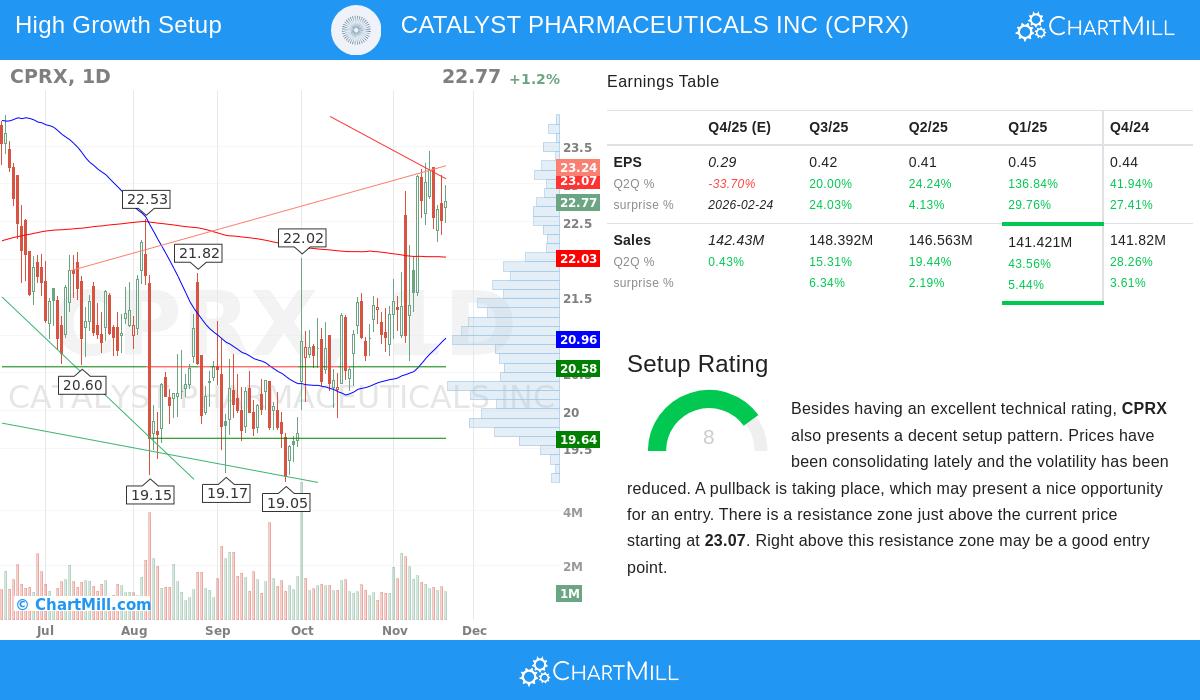
While fundamentals give the "why" for a stock's possibility, technical analysis can assist with the "when." The technical analysis for CPRX currently shows a positive and improving chart formation. Both the near-term and longer-term directions are scored as positive, confirming the stock is in a general upward trend. More exactly, the analysis finds that the stock is now displaying a bull flag formation.
A bull flag formation usually happens after a solid price rise, followed by a time of sideways movement where prices dip a little on lower trading volume. This formation is seen as a halt in the trend before a possible resumption of the earlier upward move. For traders and investors using this strategy, such a formation can mark a possible purchase point. The technical report states that prices have been moving sideways recently with lower price swings, and a move above the nearby resistance area could indicate the next step up. The full technical view, including important support and resistance points, is found in the technical analysis report.
A Cohesive Investment Thesis
The strong part of Catalyst Pharmaceuticals is the combination of its good fundamental scores and its improving technical position. The company is not only a quickly growing, profitable, and financially sound business; its stock is also performing well from a price momentum view. The forming bull flag formation indicates that market players might be gathering shares during this sideways phase, possibly preparing for a breakout that matches the company's solid basic growth story. This alignment between a solid business base and a positive technical formation is exactly what the combined screening method aims to find.
This review of Catalyst Pharmaceuticals shows how mixing growth fundamentals with technical timing can locate possible chances. Investors curious about finding other stocks that match this exact profile of solid growth and positive technical formations can explore more results through this dedicated stock screen.
Disclaimer: This article is for informational purposes only and does not constitute investment advice, a recommendation, or an offer or solicitation to buy or sell any securities. The analysis presented is based on data believed to be reliable, but its accuracy cannot be guaranteed. All investments involve risk, including the possible loss of principal. You should conduct your own research and consult with a qualified financial advisor before making any investment decisions.