
CAPRI HOLDINGS LTD (NYSE:CPRI) has been identified by a systematic scan for technical breakout formations, a process intended to find stocks displaying both good technical condition and positive chart formations for possible purchase. This method uses two specific metrics: the ChartMill Technical Rating, which measures a stock's general trend condition and momentum, and the ChartMill Setup Quality Rating, which judges the condition of price patterns that frequently come before notable price changes. Stocks achieving high scores on both metrics often present situations where established trends match with positive price structures, providing good potential scenarios for breakout traders.
Technical Strength Review
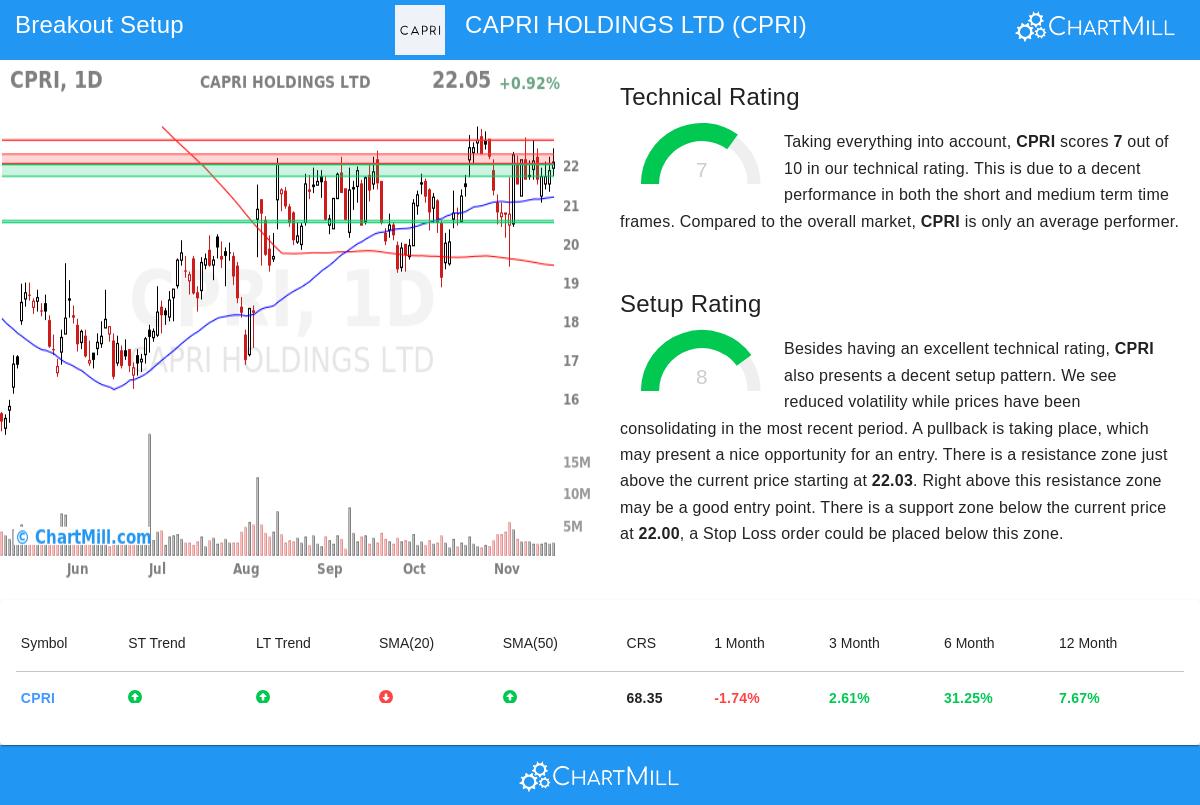
CAPRI HOLDINGS shows good technical condition with a Technical Rating of 7, suggesting the stock is in a confirmed upward trend based on ChartMill's scoring method. This score indicates several positive technical features that match the breakout strategy's need for stocks with existing momentum. The detailed technical analysis report shows several improving factors:
- Both long-term and short-term trends are positive, giving confirmation across different time periods
- The stock is currently trading in the higher part of its 52-week range (19.11-26.23), displaying continued upward momentum
- Price remains above important moving averages including the SMA20 (21.71), SMA50 (21.16), and SMA100 (20.53)
- Relative strength measurements show CPRI is performing better than 70% of stocks in the Textiles, Apparel & Luxury Goods industry
For breakout traders, a good technical rating is important because it shows the stock has the existing momentum required to possibly maintain a breakout move instead of returning to a period of little change. CPRI's technical condition points to institutional interest and positive price momentum that could help continued upward movement.
Setup Condition Review
In addition to technical condition, CPRI shows a positive setup formation with a Setup Rating of 8, indicating the stock is creating a positive period of little change within its larger upward trend. This high setup score deals with the important timing part of breakout trading by finding times where decreased price movement and set price floors create positive conditions for purchase. The current setup displays several features valued by technical traders:
- Prices have been moving in a range between 19.37 and 22.98 over the last month, letting the stock reduce overbought conditions
- Several set price floors exist below current prices, with the closest good floor being between 21.71 and 22.03
- A price ceiling is clearly set at 22.27, giving a reasonable breakout point
- Lowered price movement during the period of little change creates a situation for a possible price movement increase breakout
The mix of set price floors and ceilings with recent price decrease creates a situation where a breakout above the price ceiling could indicate the return of the upward trend with clearly set risk measures.
Trading Points
The technical analysis indicates a possible breakout formation with a purchase point at 22.28, just above the identified price ceiling. This point represents a place where the stock would show enough condition to overcome recent selling activity. A stop loss at 21.69, placed below the nearest group of price floors, would limit possible losses to about 2.65% on the trade. The fairly close risk measures reflect the condition of the setup, although traders should note the stop distance represents less than the average true range of 4.16%, possibly raising the chance of being stopped out by normal price changes.
Market Situation
While CPRI shows individual condition, it is important to note the wider market presents a mixed situation with the S&P500 showing a negative long-term trend in spite of recent short-term positive movement. This situation highlights the importance of careful stock selection, making good breakout formations like CPRI especially useful for traders looking for chances during uncertain market periods.
Finding Other Chances
The process that found CAPRI HOLDINGS can be used regularly to find similar chances across the market. For traders interested in reviewing current technical breakout candidates, the Technical Breakout Setups screen gives daily updated results filtered for stocks showing both good technical ratings and high-condition setup formations.
Disclaimer: This analysis is based on technical indicators and chart formations and should not be considered investment advice. All trading and investment decisions involve risk, and individuals should conduct their own research and consult with financial advisors before making investment decisions. Past performance does not guarantee future results.