
Investors looking for companies with solid growth possibilities frequently encounter the difficulty of finding not only businesses with sound foundations but also those displaying positive technical momentum. One technique that brings together these views filters for stocks showing healthy growth features together with encouraging technical breakout formations. This combined review intends to identify companies with firm basic business measures that are also receiving positive attention in the market, possibly indicating the start of a continued upward price trend. The method concentrates on firms showing increasing revenue and earnings growth, good profitability, and firm financial bases, while their stock charts display consolidation formations that could come before notable breakouts.
Fundamental Strength Evaluation
Corcept Therapeutics Inc (NASDAQ:CORT) displays an interesting fundamental picture that matches growth investment standards. The company's financial condition provides a firm base for future development, with a number of important measures being notable:
- The company keeps very good financial condition with no debt and healthy liquidity ratios
- Profitability measures stay notable with a 14.32% profit margin and 16.79% return on equity
- Revenue growth has been significant at 17.92% over the last year
- Future growth forecasts look healthy with estimated EPS growth of 54.86% and revenue growth of 30.93%
These fundamental traits are important for growth investors since companies with healthy balance sheets and profitability can more effectively finance their growth projects without depending extensively on outside funding. The rising revenue growth rate shows the company is effectively seizing market chances, while the very good health rating implies low bankruptcy risk even in economic slowdowns. The full fundamental analysis report shows more positive points that add to the overall investment view.
Growth Path Review
The growth picture of Corcept Therapeutics shows several features that growth investors usually look for. While the company saw a short-term drop in earnings per share over the last year, the longer-term path and future outlook present a more hopeful view. The 17.11% average yearly revenue growth over recent years shows steady business development, and the forecasted increase to 30.93% yearly revenue growth suggests the company may be moving into a new stage of market presence or product acceptance.
This growth formation matches what growth investors generally look for, companies moving from confirmed growth into faster expansion periods. The pharmaceutical company's concentration on creating treatments for serious disorders by adjusting cortisol effects represents a specialized market with notable addressable possibility. The mix of healthy historical results and even healthier future expectations creates the kind of growth narrative that often draws investor attention, especially when combined with the company's firm financial base.
Technical Pattern Inspection
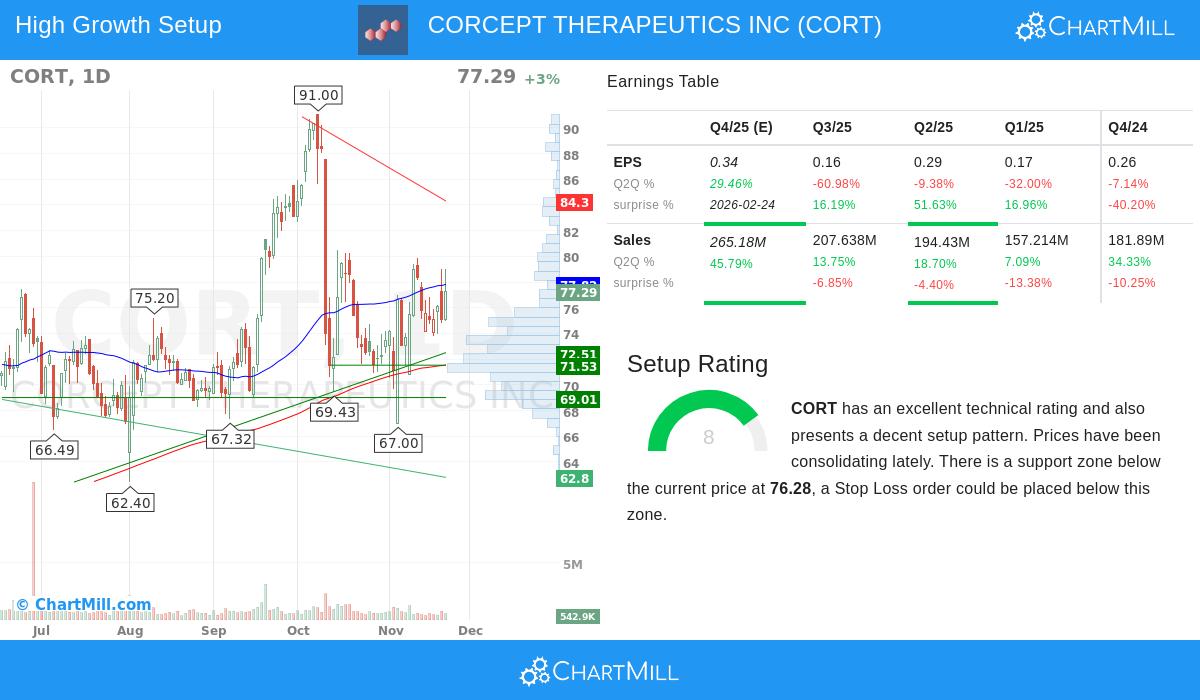
From a technical viewpoint, Corcept Therapeutics shows several positive formations that match its fundamental positives. The stock presently shows a technical rating of 8 out of 10, showing healthy price movement compared to both the wider market and its industry counterparts. Several technical elements add to this evaluation:
- The long-term direction stays positive while the short-term direction shows consolidation
- The stock does better than 88% of all stocks on a yearly performance basis
- Several support levels are present between $67.17 and $76.28, offering possible downside protection
- Resistance is located near the $77.82 to $79.01 range, with a move above this area possibly indicating more upward potential
The technical pattern becomes especially relevant for growth investors because breakouts from consolidation formations often come before notable price moves. When fundamentally healthy companies start showing technical health, it may suggest that the market is beginning to acknowledge and value the growth possibility. The present arrangement indicates the stock is testing resistance levels after a time of consolidation, which could lead to a clear move higher if buying interest grows. The complete technical analysis report gives more background on these formations.
Investment Points
While the mix of fundamental health and technical placement looks encouraging, investors should think about several elements. The company's valuation measures show a varied picture, with standard metrics like P/E ratio appearing high compared to market averages, though more acceptable relative to industry counterparts. This valuation situation is typical among growth stocks where investors pay higher multiples for expected future growth.
The pharmaceutical industry also has built-in regulatory and development risks that could affect growth paths. However, the company's commercial-stage status with already marketed products gives some revenue steadiness compared to earlier-stage biopharma companies. The technical pattern indicates near-term price direction could be decided by whether the stock can successfully move through present resistance levels, which would probably need continued positive fundamental progress or wider market involvement.
Locating Comparable Chances
For investors curious about using similar filtering techniques to find other possible opportunities, the Strong Growth Stocks with Good Technical Setup Ratings screen offers a structured way to discover companies showing both fundamental growth features and encouraging technical formations. This filtering approach can help investors effectively find possible candidates for more study across different sectors and market sizes.
Disclaimer: This article presents objective analysis of a security based on available data and should not be considered investment advice. All investments carry risk, and readers should conduct their own research and consult with financial professionals before making investment decisions. Past performance does not guarantee future results.