
CORCEPT THERAPEUTICS INC (NASDAQ:CORT) was identified as an affordable growth stock by our stock screener. CORT is showing great growth, but also scores well on profitability, solvency and liquidity. At the same time it seems to be priced reasonably. We'll explore this a bit deeper below.
Assessing Growth Metrics for CORT
Every stock receives a Growth Rating from ChartMill, ranging from 0 to 10. This rating assesses various growth aspects, including historical and projected EPS and revenue growth. CORT boasts a 9 out of 10:
- The Earnings Per Share has grown by an impressive 30.53% over the past year.
- Measured over the past years, CORT shows a quite strong growth in Earnings Per Share. The EPS has been growing by 9.71% on average per year.
- CORT shows a strong growth in Revenue. In the last year, the Revenue has grown by 39.93%.
- CORT shows quite a strong growth in Revenue. Measured over the last years, the Revenue has been growing by 17.11% yearly.
- The Earnings Per Share is expected to grow by 54.37% on average over the next years. This is a very strong growth
- Based on estimates for the next years, CORT will show a very strong growth in Revenue. The Revenue will grow by 29.15% on average per year.
- When comparing the EPS growth rate of the last years to the growth rate of the upcoming years, we see that the growth is accelerating.
- When comparing the Revenue growth rate of the last years to the growth rate of the upcoming years, we see that the growth is accelerating.
Assessing Valuation for CORT
ChartMill provides a Valuation Rating to every stock, ranging from 0 to 10. This rating assesses various valuation aspects, comparing price to earnings and cash flows, while considering factors like profitability and growth. CORT boasts a 5 out of 10:
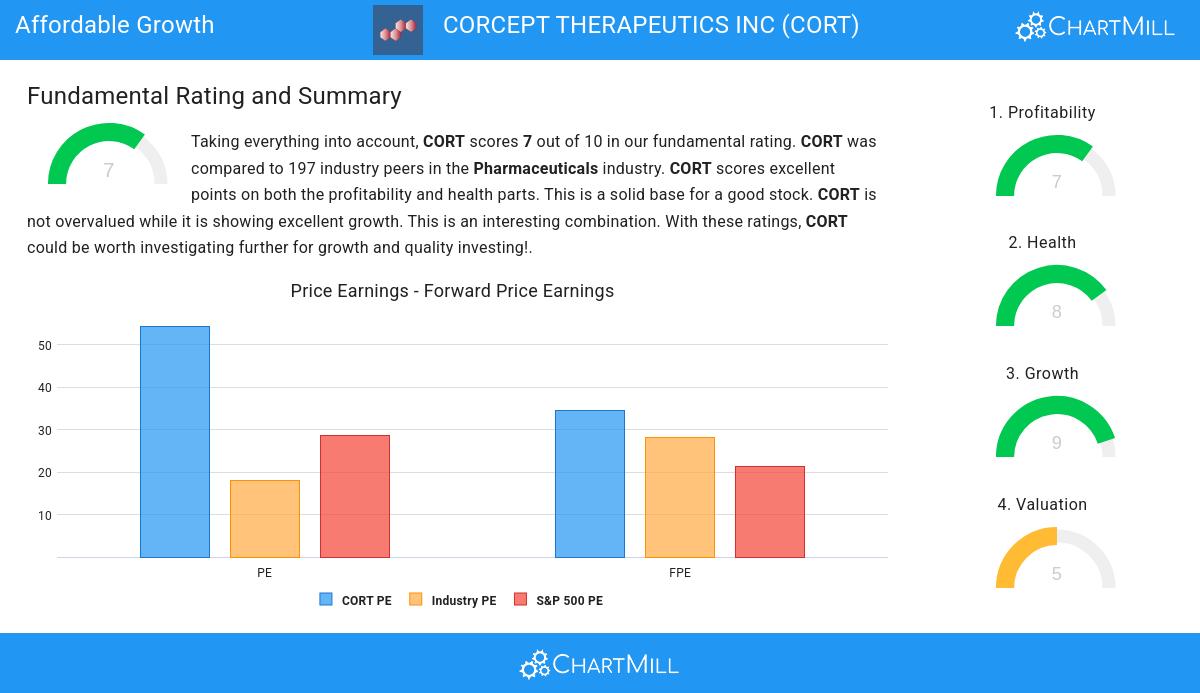
- Compared to the rest of the industry, the Price/Earnings ratio of CORT indicates a somewhat cheap valuation: CORT is cheaper than 79.70% of the companies listed in the same industry.
- CORT's Price/Forward Earnings ratio is a bit cheaper when compared to the industry. CORT is cheaper than 77.67% of the companies in the same industry.
- Compared to the rest of the industry, the Enterprise Value to EBITDA ratio of CORT indicates a somewhat cheap valuation: CORT is cheaper than 76.14% of the companies listed in the same industry.
- CORT's Price/Free Cash Flow ratio is a bit cheaper when compared to the industry. CORT is cheaper than 78.68% of the companies in the same industry.
- CORT's low PEG Ratio(NY), which compensates the Price/Earnings for growth, indicates a rather cheap valuation of the company.
- CORT has a very decent profitability rating, which may justify a higher PE ratio.
- A more expensive valuation may be justified as CORT's earnings are expected to grow with 67.86% in the coming years.
How We Gauge Health for CORT
ChartMill assigns a Health Rating to every stock. This score ranges from 0 to 10 and evaluates the different health aspects like liquidity and solvency, both absolutely, but also relative to the industry peers. CORT scores a 8 out of 10:
- CORT has an Altman-Z score of 29.24. This indicates that CORT is financially healthy and has little risk of bankruptcy at the moment.
- Looking at the Altman-Z score, with a value of 29.24, CORT belongs to the top of the industry, outperforming 95.94% of the companies in the same industry.
- CORT has no outstanding debt. Therefor its Debt/Equity and Debt/FCF ratios are 0 and belong to the best of the industry.
- CORT has a Current Ratio of 3.35. This indicates that CORT is financially healthy and has no problem in meeting its short term obligations.
- CORT has a Quick Ratio of 3.26. This indicates that CORT is financially healthy and has no problem in meeting its short term obligations.
How do we evaluate the Profitability for CORT?
Discover ChartMill's exclusive Profitability Rating, a proprietary metric that assesses stocks on a scale of 0 to 10. It takes into consideration various profitability ratios and margins, both in absolute terms and relative to industry peers. Notably, CORT has achieved a 7:
- CORT has a Return On Assets of 16.80%. This is amongst the best in the industry. CORT outperforms 97.46% of its industry peers.
- With an excellent Return On Equity value of 20.78%, CORT belongs to the best of the industry, outperforming 93.40% of the companies in the same industry.
- Looking at the Return On Invested Capital, with a value of 16.89%, CORT belongs to the top of the industry, outperforming 92.89% of the companies in the same industry.
- Looking at the Profit Margin, with a value of 20.92%, CORT belongs to the top of the industry, outperforming 93.91% of the companies in the same industry.
- CORT's Operating Margin of 20.29% is amongst the best of the industry. CORT outperforms 86.29% of its industry peers.
- With an excellent Gross Margin value of 98.39%, CORT belongs to the best of the industry, outperforming 97.97% of the companies in the same industry.
More Affordable Growth stocks can be found in our Affordable Growth screener.
Our latest full fundamental report of CORT contains the most current fundamental analsysis.
Disclaimer
This is not investing advice! The article highlights some of the observations at the time of writing, but you should always make your own analysis and invest based on your own insights.