
Investors often seek to balance the potential for high returns with a disciplined approach to risk. One method that attempts to achieve this is combining strong fundamental growth characteristics with favorable technical chart patterns. The strategy focuses on identifying companies that are not only increasing their earnings and revenue at an impressive rate but are also demonstrating positive price momentum and constructive chart formations, suggesting institutional interest and a higher chance of continued upward movement. This dual-lens approach aims to find stocks where the underlying business strength is being confirmed by market action.
The Vita Coco Co Inc (NASDAQ:COCO) presents a notable case study for this investment method. As a leading producer and distributor of coconut water and related products, the company has carved out a significant niche in the beverage industry.
A Foundation of Strong Fundamental Growth
At its core, the growth investing strategy demands companies that are increasing faster than their peers. Vita Coco’s fundamental report confirms its status as a strong growth stock. The company earns a solid Growth Rating of 8 out of 10, driven by exceptional historical and projected expansion.
- Impressive Historical Trajectory: Over the past year, revenue grew by 23.1%, while earnings per share (EPS) increased by 16.2%. The longer-term picture is even more striking, with an average annual EPS growth of 40.9% over recent years.
- Solid Future Outlook: Analysts expect this momentum to continue, with forward EPS growth projected at 23.6% annually. This consistent and high-level growth is a primary filter for the strategy, as it indicates a company successfully scaling its operations and capturing market share.
Beyond pure growth, the strategy requires "decent profitability and health" to ensure the growth is sustainable and not fueled by excessive risk. Vita Coco performs well here also, with a Profitability Rating of 7 and an outstanding Financial Health Rating of 9.
- Profitability Strength: The company has a Return on Invested Capital (ROIC) of 18.1%, outperforming 90% of its beverage industry peers. Its profit margin has shown marked improvement, reaching 11.4%.
- Exceptional Financial Health: With no debt on its balance sheet and current and quick ratios that are among the best in its industry, Vita Coco operates from a position of notable financial strength. This provides a significant buffer against economic downturns and ample flexibility to fund future growth initiatives.
You can review the full details of this analysis in the detailed fundamental report for COCO.
A Technical Picture Aligning with Fundamentals
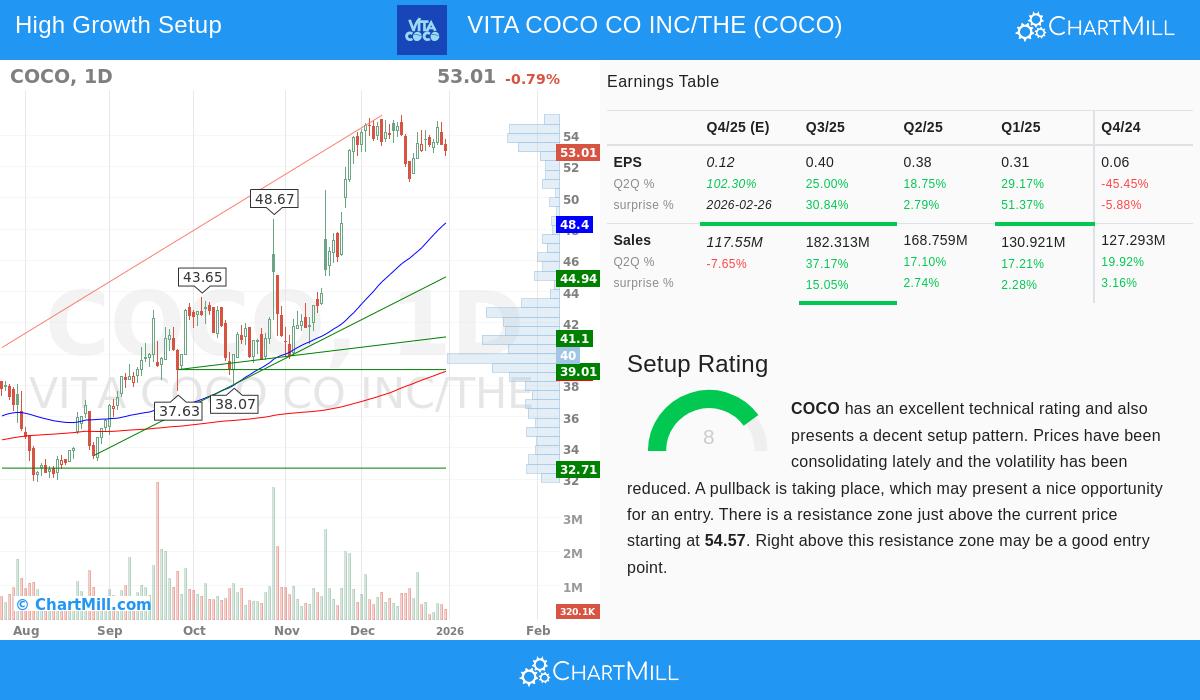
While strong fundamentals identify a promising company, technical analysis helps time the investment by assessing market sentiment and price trends. Vita Coco’s technical report reveals a chart that complements its fundamental story, earning a high Technical Rating of 9 and a Setup Rating of 8.
- Positive Price Trends: Both the long-term and short-term trends for COCO are firmly positive. The stock is trading well above its key moving averages (50-day, 100-day, and 200-day), which are all in rising configurations, a classic sign of a healthy uptrend.
- Strong Relative Performance: COCO is outperforming 92% of all stocks in the market over the past year and 93% of its peers in the Beverages industry. This relative strength is a key indicator of institutional demand and leadership.
- Constructive Consolidation: After a strong rally, the stock has entered a period of consolidation, forming what technical analysts describe as a potential "bull flag" pattern. This pattern often resolves with a continuation of the prior uptrend. The report notes reduced volatility and lower volume during this pullback, which are generally considered healthy signs within an ongoing bull move.
The technical setup suggests the stock may be preparing for its next move higher, with a defined resistance zone just above current prices. This pattern is exactly what the screening method seeks: a fundamentally strong stock taking a pause within a powerful uptrend, possibly offering a strategic entry point.
For a visual breakdown of these patterns and key levels, see the in-depth technical analysis for COCO.
Why This Combination Matters
The connection between Vita Coco’s fundamental and technical profiles is what makes it significant for this strategy. The stellar growth and very solid financial health provide the "why" for the stock’s potential, it is a company gaining momentum in its market. The positive technical trends and constructive chart pattern provide the "when," offering evidence that the market is recognizing this fundamental strength and that the path of least resistance remains upward. This combination aims to filter out companies that are fundamentally cheap but technically weak, or those in a speculative bubble without earnings to support the price.
Finding Similar Opportunities
Vita Coco was identified using a predefined screen that filters for stocks showing strong growth, decent profitability and health, along with promising technical breakout patterns. This systematic method can help find other potential candidates that meet similar strict criteria.
If you are interested in exploring other stocks that currently fit this "Strong Growth Stocks with good Technical Setup Ratings" profile, you can view the live screen results here.
Disclaimer: This article is for informational and educational purposes only and does not constitute investment advice, a recommendation, or an offer to buy or sell any security. The analysis presented is based on data and reports provided by third parties. Investing involves risk, including the potential loss of principal. You should conduct your own thorough research and consult with a qualified financial advisor before making any investment decisions.


