
Technical investors often look for stocks showing both good momentum and consolidation patterns that indicate possible breakouts. One method uses filters to find securities with high technical ratings, pointing to good price trends, mixed with high setup quality scores that show tight trading ranges and clear support levels. This process tries to find stocks ready for upward moves while giving clear risk management points through technical analysis.
Technical Strength Assessment
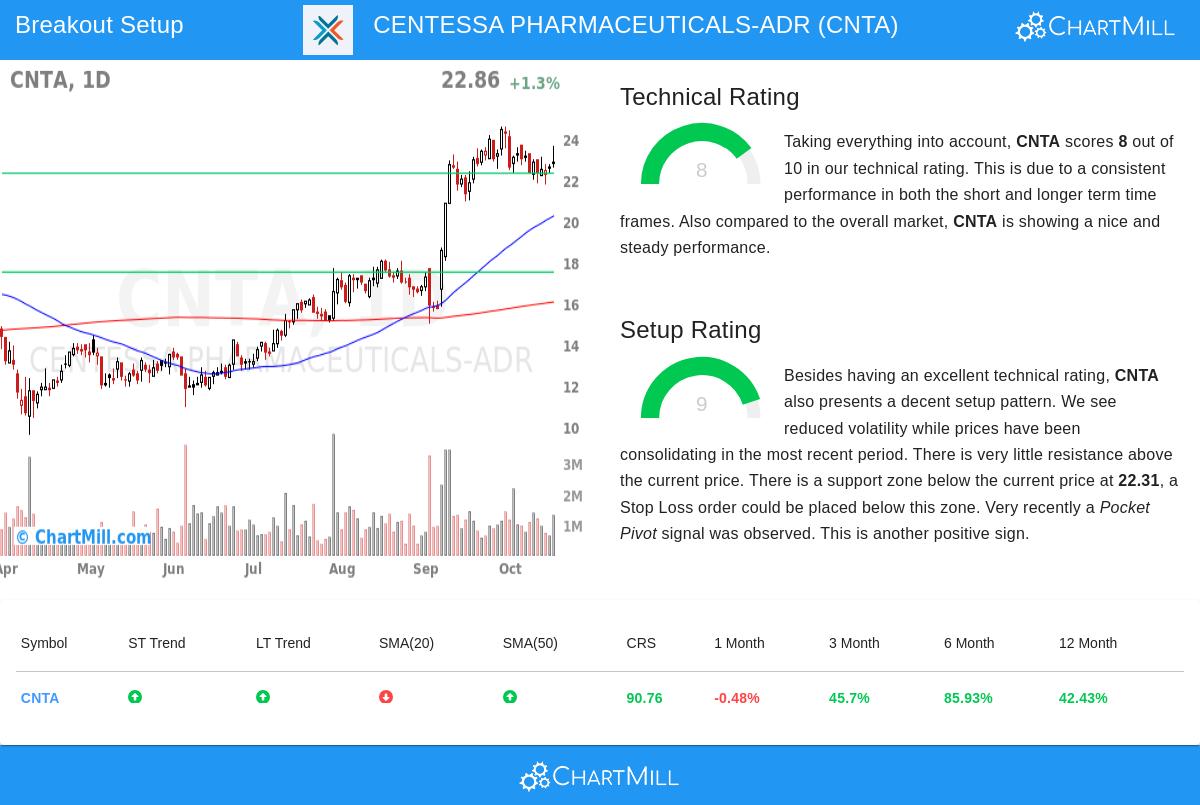
CENTESSA PHARMACEUTICALS-ADR (NASDAQ:CNTA) shows notable technical features based on its ChartMill Technical Rating of 8 out of 10. This number shows several good points that technical investors look for when finding stocks with continued momentum.
Important technical points include:
- Both short-term and long-term trends are good, showing steady upward momentum across different time periods
- The stock is now trading close to its 52-week high of $24.57, showing good relative performance
- Price action stays above several important moving averages, including the SMA50 ($20.24) and SMA200 ($16.06)
- Relative strength is better than 90% of all stocks and 77% of biotechnology sector companies
The technical rating system looks at items like trend strength, moving average position, and relative performance against both the wider market and sector companies. For CENTESSA PHARMACEUTICALS, these measures together point to a technically sound stock with a continued upward path, making it a good fit for momentum-based plans.
Setup Quality Analysis
Besides technical strength, CENTESSA shows a notable Setup Quality Rating of 9 out of 10, showing the stock has formed a consolidation pattern that might come before a notable price move. This high setup number shows several good conditions for possible breakout traders.
Notable setup features:
- Recent trading has happened within a set range between $21.78 and $24.57, letting volatility settle
- Several set support zones exist below current prices, with the closest at $22.31 giving a sensible stop-loss level
- A recent Pocket Pivot signal was seen, showing institutional buying
- Lower volatility mixed with nearness to resistance indicates chance for upward movement
The setup quality measure looks at how well a stock's current pattern gives set entry and exit points. CENTESSA's consolidation near highs, mixed with clear support levels and falling volatility, makes conditions that technical traders often look for before starting positions in expectation of breakouts.
Trading Considerations
For investors looking at this possible breakout setup, the technical analysis indicates specific price levels to watch. The noted entry point is at $23.68, just above recent resistance, while the suggested stop-loss at $22.29 sits below the closest support zone. This makes a risk of about 5.87% on the trade, though traders might change these levels based on personal risk comfort.
The stock's average daily volume of about 1.17 million shares gives enough liquidity for position entry and exit. The Average True Range of 4.27% shows moderate daily volatility, which should be included in position size choices.
Market Context
While CENTESSA shows good individual technical features, it is important to note the wider market setting. The S&P 500 currently shows a good short-term trend with a neutral long-term view, giving a generally supportive background for breakout plans, though sector-specific items should also be considered given CENTESSA's biotechnology focus.
The company's clinical-stage pharmaceutical pipeline, especially its orexin receptor agonist program for neurological disorders, represents the fundamental background against which these technical patterns are forming. Technical traders usually watch such basic developments while mainly using price action for timing choices.
For investors looking for similar technical breakout chances, more filter results can be found using the Technical Breakout Setups screener, which regularly updates with stocks showing high technical and setup ratings.
Disclaimer: This analysis is based on technical indicators and pattern recognition and should not be considered investment advice. All trading and investment decisions involve substantial risk and should be made based on individual research, risk tolerance, and consultation with financial professionals. Past performance does not guarantee future results.