
For investors who use technical analysis to find possible opportunities, the idea of a breakout setup is a fundamental strategy. The aim is to locate stocks that are in a firm, clear uptrend and are also halting to rest, gathering force for their next move up. This approach tries to take part in the momentum of a stock as it leaves a specific trading area, giving a more distinct entry point and a sensible level to set a protective stop-loss order. A methodical way to locate these setups is by using tools that measure both the basic trend force and the character of the present resting pattern.
Core & Main Inc-Class A (NYSE:CNM) recently appeared from a screening process that looks for stocks showing both a high technical condition rating and a high setup quality score. This pairing indicates CNM may be set for a possible technical breakout, making it an option deserving of more study for trend-following investors.
Judging the Basic Trend Force
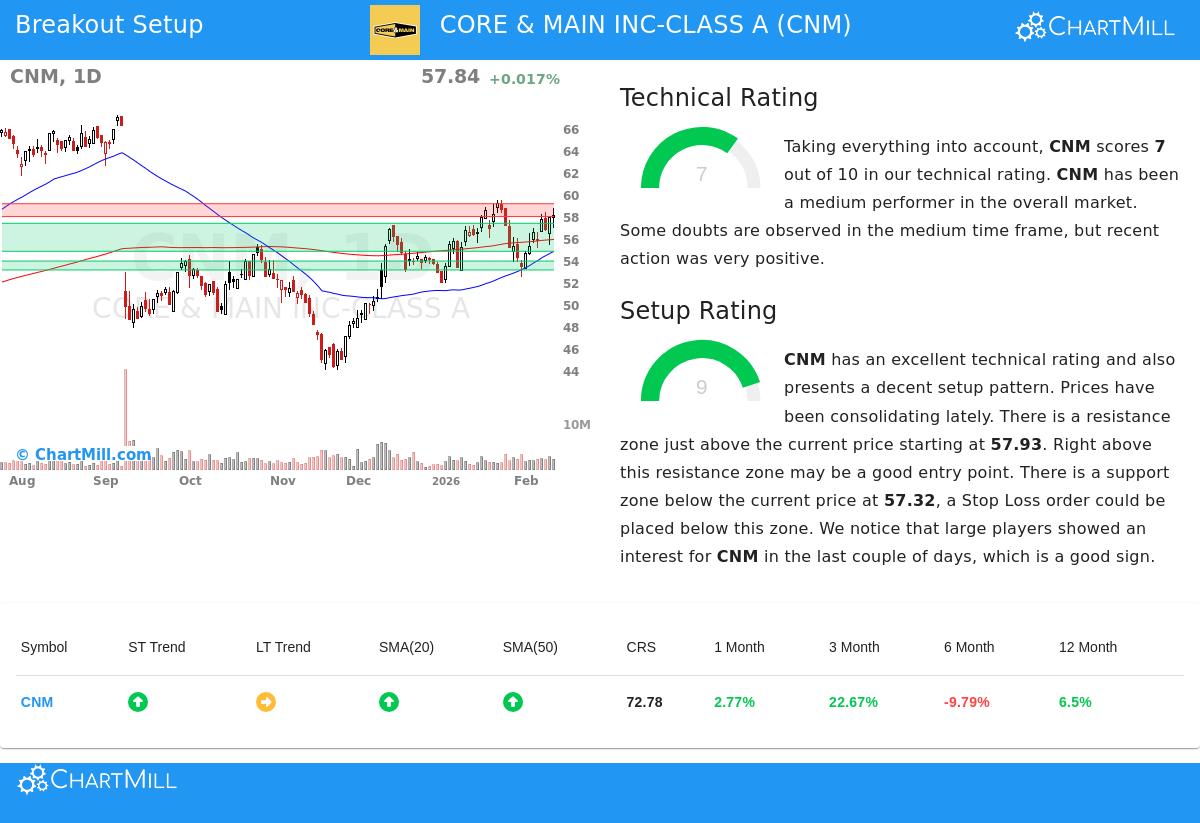
The first part of a sound breakout setup is a stock's total technical condition, which verifies the main trend is positive. ChartMill's own Technical Rating, a score from 0 to 10, does this. A rating of 7 or more is usually seen as showing an uptrend. CNM presently has a Technical Rating of 7, putting it directly in this positive area.
A more detailed view of the full technical report shows the parts behind this score:
- Trend Position: The short-term trend for CNM is rated as positive, while the longer-term trend is neutral. This is a good sign that the stock's momentum is getting better and could be changing into a more lasting upward stage.
- Moving Average Backing: The stock is trading above its important short- and medium-term moving averages (the 20-day, 50-day, and 100-day SMAs), and all these averages are in a rising arrangement. This layered position of support levels is a standard trait of a good uptrend.
- Relative Results: Over the last year, CNM has done better than 72% of all stocks in the market. While a lot of this force is new, it highlights the stock's capacity to draw money and outpace the wider market.
A firm technical rating is key because it answers the first question of which stock to think about. It removes stocks in downtrends or disorderly sideways movement, focusing on market leaders where the chance of a good breakout is, by the numbers, greater.
Judging the Setup and Resting Pattern
A firm trend by itself is not a sign to buy; entering after a fast, long rise often results in buying at a high. The second key question is when to enter. This is where the Setup Quality Rating becomes important. It measures the character of a stock's present resting phase, searching for narrow, low-volatility trading areas that frequently come before a new directional move. CNM does very well here with a notable Setup Rating of 9 out of 10.
The technical report explains why the setup looks good:
- Specific Trading Area: Over the last month, CNM has traded between $52.46 and $59.45. It is now testing the higher side of this area, indicating it is tightening near a possible breakout point.
- Clear Support and Resistance: The study finds a clear resistance area between $57.93 and $59.10. A firm move above this area could show the beginning of a new uptrend. On the other hand, a firm support area exists between $54.77 and $57.32, giving a logical zone below which a stop-loss order could be set to control risk.
- Large Investor Attention: The report states that big players have shown attention in CNM in recent days, as seen by volume study. Buying by large investors can be a confirming factor for a possible breakout.
This high-character rest is what makes a breakout strategy workable. It gives a clear level to observe for an entry (above resistance) and a close level to describe risk (below support), making a positive risk/reward situation.
An Example Trading Situation
From the technical and setup study, an example trading idea is created. It is important to note this is a descriptive example from the numerical model, not a suggestion.
- Possible Entry: A buy order could be set at $59.11, just above the found resistance area, to confirm the breakout is happening.
- Possible Stop-Loss: A stop-loss order could be placed at $54.76, just below the main support area.
- Risk Details: This setup would mean a risk of about 7.36% on the trade itself. For a portfolio manager looking to risk 1% of total money on this idea, the position size would be about 13.6%.
This organized method shows how the technical and setup ratings can change into a specific, rules-based trading plan with set risk.
Locating Like Opportunities
CNM shows the kind of opportunity that methodical screens are made to find. For investors wanting to see a new list of stocks that fit similar standards of firm technical condition and high-character resting patterns, new options are found each day. You can view the present Technical Breakout Setups screen yourself here.
Disclaimer: This article is for information only and does not make up investment advice, a suggestion, or an offer to buy or sell any security. The study is based on technical data and automatic scoring models, which can change. All investing and trading includes risk, including the possible loss of principal. Investors should do their own study and careful checking and think about talking with a skilled financial professional before making any investment choices. The example trade situation is automatically made for descriptive reasons and is not a promise of future results.