
Quality investors are looking for the best of the best. Companies which are growing steadily and consistently, but are also in excellent financial condition. We will have a look here to see if CME GROUP INC (NASDAQ:CME) is suited for quality investing. Investors should of course do their own research, but we spotted CME GROUP INC showing up in our Caviar Cruise quality screen, so it may be worth spending some more time on it.
A Deep Dive into CME GROUP INC's Quality Metrics.
- CME has demonstrated significant revenue growth over the past 5 years, with a 13.14% increase. This underscores the company's ability to adapt to market dynamics and capitalize on growth opportunities.
- The ROIC excluding cash and goodwill of CME stands at 378.0%, reflecting the company's strong financial management and profitability. This metric underscores its ability to generate favorable returns on the capital invested in its core operations.
- The Debt/Free Cash Flow Ratio of CME stands at 0.97, reflecting the company's prudent capital structure and cash flow dynamics. This ratio highlights the company's ability to generate robust free cash flow relative to its debt obligations.
- The Profit Quality (5-year) of CME stands at 106.0%, highlighting its ability to consistently generate reliable profits. This metric underscores the company's strong business fundamentals and reinforces its position as a financially stable entity.
- With a robust 5-year EBIT growth of 19.95%, CME showcases its ability to consistently expand its operating profitability. This trend indicates the company's effective cost management and revenue generation strategies.
- CME has achieved impressive EBIT 5-year growth, surpassing its Revenue 5-year growth. This indicates the company's ability to improve its profitability and operational efficiency, highlighting its strong financial performance.
Fundamental Analysis Observations
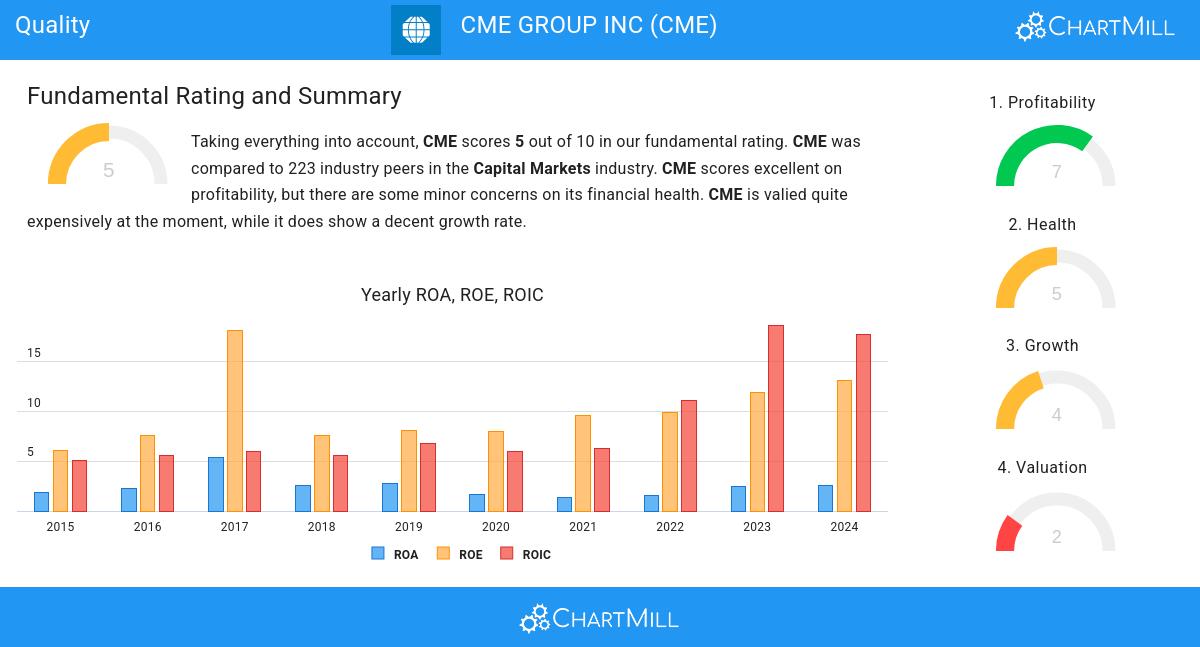
ChartMill assigns a proprietary Fundamental Rating to each stock. The score is computed daily by evaluating various fundamental indicators and properties. The score ranges from 0 to 10.
Taking everything into account, CME scores 5 out of 10 in our fundamental rating. CME was compared to 223 industry peers in the Capital Markets industry. While CME belongs to the best of the industry regarding profitability, there are some minor concerns on its financial health. CME is quite expensive at the moment. It does show a decent growth rate.
Our latest full fundamental report of CME contains the most current fundamental analsysis.
More ideas for quality investing can be found on ChartMill in our Caviar Cruise screen.
Keep in mind
Important Note: The content of this article is not intended as trading advice. It is essential to perform your own analysis and exercise caution when making trading decisions. The article presents observations created by automated analysis but does not guarantee any trading or investment outcomes. Always trade responsibly and make independent judgments.