
Technical analysis often uses identifying stocks that not only show strong existing momentum but also offer clear, actionable entry points. One method for doing this is by combining two proprietary metrics: the ChartMill Technical Rating, which measures the general health and trend strength of a stock, and the ChartMill Setup Quality Rating, which looks at the consolidation patterns that frequently come before breakouts. This two-part method helps investors concentrate on securities that are both technically sound and set for possible upward moves, reducing guesswork and highlighting disciplined entry strategies.
COMERICA INC (NYSE:CMA) recently appeared in a technical breakout screen based on these conditions, displaying interesting characteristics that may draw momentum and breakout-focused traders. The stock’s present profile indicates a mix of maintained strength and a current consolidation pattern, offering a structured chance according to technical indicators.
Technical Strength and Trend Consistency
A high ChartMill Technical Rating is important for identifying stocks with established positive momentum, reducing the danger of entering during a downtrend or time of instability. COMERICA does very well in this area, having a perfect rating of 10. This score shows high performance across several technical aspects:
- Both long-term and short-term trends are positive, showing agreement across timeframes.
- The stock is trading above important moving averages (20, 50, 100, and 200-day SMAs), which are all increasing, a signal of maintained buyer interest.
- Relative strength is significant: CMA does better than 82% of all stocks in the market and is in the top 19% within the Banks industry.
- Price action is happening in the upper part of its 52-week range, though it is a bit behind the wider S&P 500, which is trading close to new highs.
These factors together confirm COMERICA’s technical health and indicate the stock is in a good position within its sector and the wider market. For more detailed analysis, readers can see the full technical report here.
Setup Quality and Entry Structure
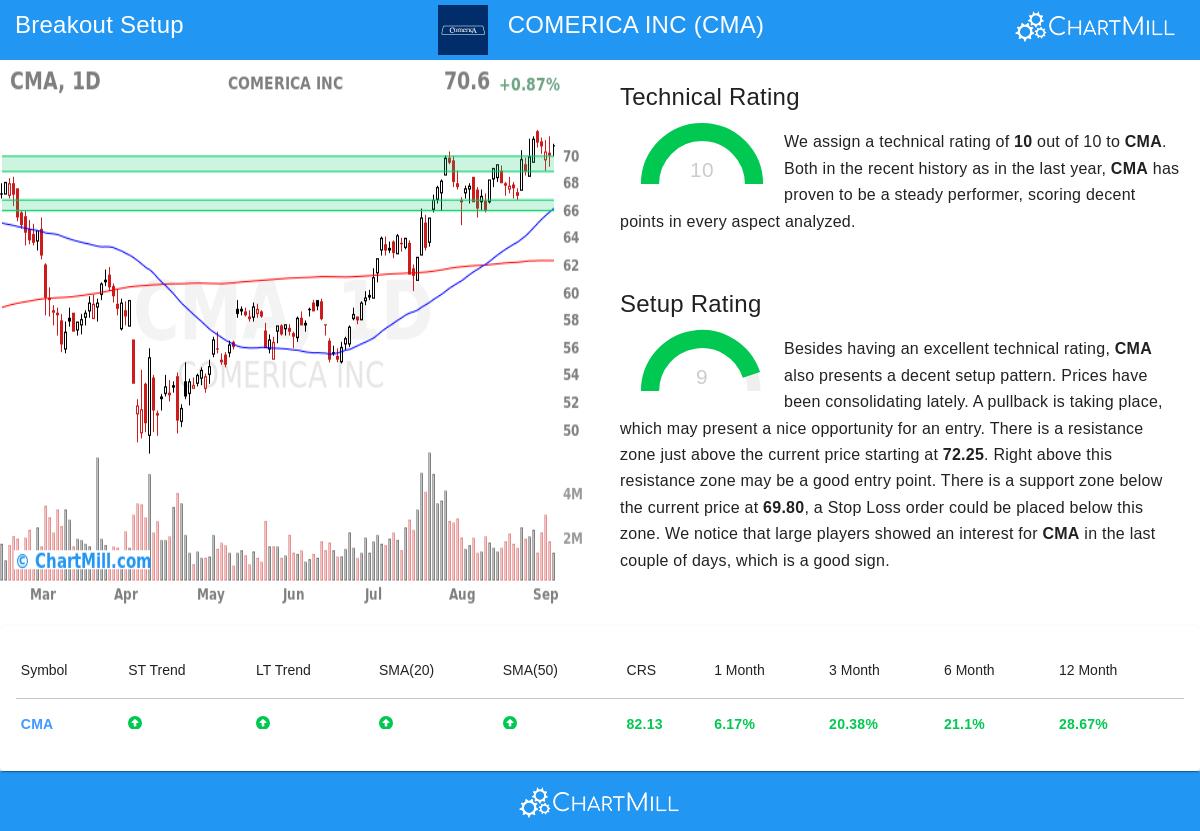
While technical strength identifies what to buy, the Setup Quality Rating deals with when to buy, highlighting consolidation phases that frequently result in breakouts. COMERICA’s Setup Rating of 9 points to a high-quality base formation, described by:
- A recent pullback creating a bull flag pattern, which often continues the earlier uptrend.
- Several set support zones, the closest being from $68.68 to $69.80, giving a logical area for stop-loss placement.
- A set resistance zone between $72.25 and $72.73; a break above this point could indicate the next move upward.
- Lowering volatility and signs of institutional accumulation, supporting the setup’s dependability.
This mix indicates that the stock is not only strong but also providing a structured risk-reward situation, with a clear point for entry (above $72.74) and exit (below $68.67).
Conclusion and Next Steps
COMERICA presents an interesting case for technical traders, mixing high trend quality with a well-outlined consolidation pattern. Its perfect Technical Rating and almost-perfect Setup Rating match the main ideas of breakout trading: concentrate on leaders and enter as new momentum starts.
For investors wanting to look into similar chances, the Technical Breakout Setups screen is refreshed daily and provides a selected list of stocks meeting these strict conditions.
,
Disclaimer: This article is for informational purposes only and does not constitute investment advice or a recommendation to buy or sell any securities. Investing involves risk, including the possible loss of principal. Readers should conduct their own research and consult with a qualified financial professional before making investment decisions.