
CELESTICA INC (NYSE:CLS) has caught the eye of our stock screener as an affordable growth stock. CLS is displaying robust growth metrics and also excels in terms of profitability, solvency, and liquidity. Additionally, it appears to be reasonably priced. Let's delve into the details.
Looking at the Growth
ChartMill assigns a proprietary Growth Rating to each stock. The score is computed by evaluating various growth aspects, like EPS and revenue growth. We take into account the history as well as the estimated future numbers. CLS was assigned a score of 8 for growth:
- CLS shows a strong growth in Earnings Per Share. In the last year, the EPS has been growing by 61.32%, which is quite impressive.
- Measured over the past years, CLS shows a very strong growth in Earnings Per Share. The EPS has been growing by 48.11% on average per year.
- CLS shows a strong growth in Revenue. In the last year, the Revenue has grown by 21.17%.
- The Revenue has been growing by 10.38% on average over the past years. This is quite good.
- The Earnings Per Share is expected to grow by 24.42% on average over the next years. This is a very strong growth
- Based on estimates for the next years, CLS will show a quite strong growth in Revenue. The Revenue will grow by 13.06% on average per year.
- The Revenue growth rate is accelerating: in the next years the growth will be better than in the last years.
Exploring CLS's Valuation
An integral part of ChartMill's stock analysis is the Valuation Rating, which spans from 0 to 10. This rating evaluates diverse valuation factors, including price to earnings and cash flows, while considering the stock's profitability and growth. CLS has received a 5 out of 10:
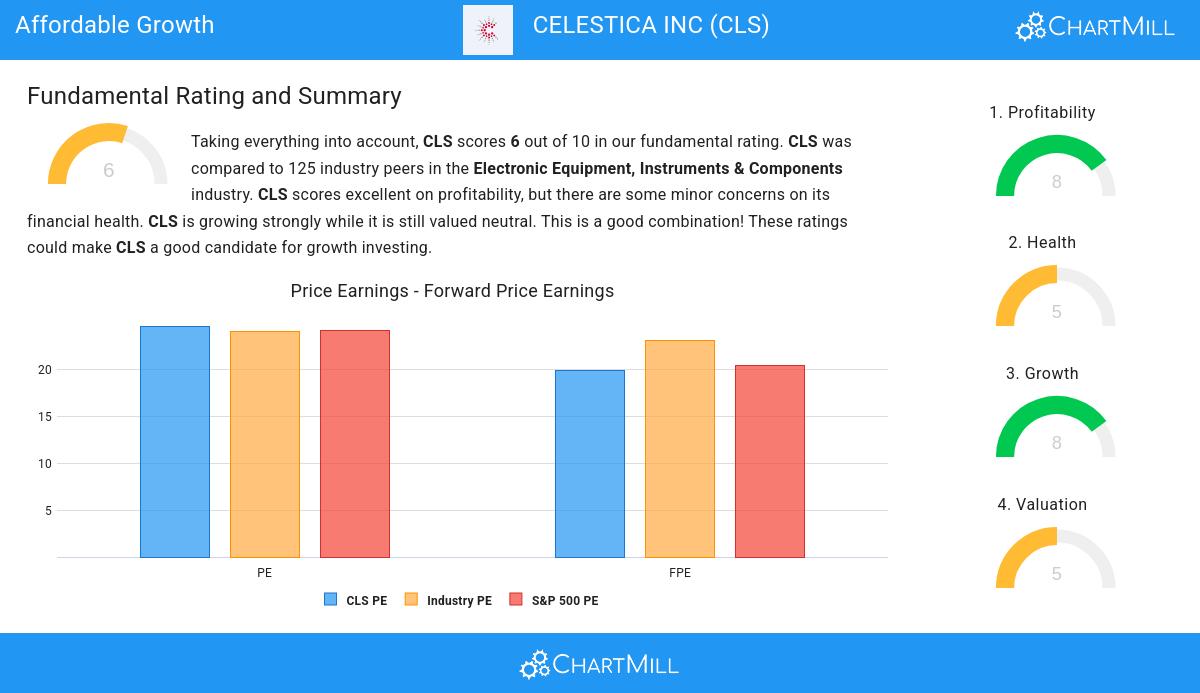
- Compared to the rest of the industry, the Price/Earnings ratio of CLS indicates a somewhat cheap valuation: CLS is cheaper than 62.40% of the companies listed in the same industry.
- Compared to the rest of the industry, the Price/Forward Earnings ratio of CLS indicates a somewhat cheap valuation: CLS is cheaper than 61.60% of the companies listed in the same industry.
- Compared to the rest of the industry, the Enterprise Value to EBITDA ratio of CLS indicates a somewhat cheap valuation: CLS is cheaper than 60.80% of the companies listed in the same industry.
- Based on the Price/Free Cash Flow ratio, CLS is valued a bit cheaper than the industry average as 60.80% of the companies are valued more expensively.
- CLS has an outstanding profitability rating, which may justify a higher PE ratio.
- A more expensive valuation may be justified as CLS's earnings are expected to grow with 22.07% in the coming years.
Deciphering CLS's Health Rating
ChartMill employs a unique Health Rating system for all stocks. This rating, ranging from 0 to 10, is determined by analyzing various liquidity and solvency ratios. For CLS, the assigned 5 for health provides valuable insights:
- An Altman-Z score of 3.76 indicates that CLS is not in any danger for bankruptcy at the moment.
- The Altman-Z score of CLS (3.76) is better than 68.00% of its industry peers.
- The Debt to FCF ratio of CLS is 2.63, which is a good value as it means it would take CLS, 2.63 years of fcf income to pay off all of its debts.
- CLS's Debt to FCF ratio of 2.63 is fine compared to the rest of the industry. CLS outperforms 71.20% of its industry peers.
- A Debt/Equity ratio of 0.41 indicates that CLS is not too dependend on debt financing.
Analyzing Profitability Metrics
ChartMill assigns a proprietary Profitability Rating to each stock. The score is computed by evaluating various profitability ratios and margins and ranges from 0 to 10. CLS was assigned a score of 8 for profitability:
- CLS has a better Return On Assets (7.31%) than 85.60% of its industry peers.
- CLS has a better Return On Equity (23.10%) than 90.40% of its industry peers.
- With an excellent Return On Invested Capital value of 15.40%, CLS belongs to the best of the industry, outperforming 92.00% of the companies in the same industry.
- CLS had an Average Return On Invested Capital over the past 3 years of 11.43%. This is above the industry average of 9.32%.
- The last Return On Invested Capital (15.40%) for CLS is above the 3 year average (11.43%), which is a sign of increasing profitability.
- The Profit Margin of CLS (4.54%) is better than 69.60% of its industry peers.
- CLS's Profit Margin has improved in the last couple of years.
- The Operating Margin of CLS (5.91%) is better than 69.60% of its industry peers.
- CLS's Operating Margin has improved in the last couple of years.
- In the last couple of years the Gross Margin of CLS has grown nicely.
Our Affordable Growth screener lists more Affordable Growth stocks and is updated daily.
For an up to date full fundamental analysis you can check the fundamental report of CLS
Keep in mind
Important Note: The content of this article is not intended as trading advice. It is essential to perform your own analysis and exercise caution when making trading decisions. The article presents observations created by automated analysis but does not guarantee any trading or investment outcomes. Always trade responsibly and make independent judgments.