
Technical investors often look for stocks displaying both good momentum and consolidation patterns that indicate possible breakout chances. The method uses two custom indicators: the ChartMill Technical Rating, which measures a stock's general technical condition, and the Setup Quality Rating, which examines consolidation patterns to find good entry points. Stocks with good scores on both measures usually show clear uptrends while trading in narrow ranges, forming conditions good for breakout moves. This method finds securities that may be ready for a possible continuation of their upward path.
Technical Strength Assessment
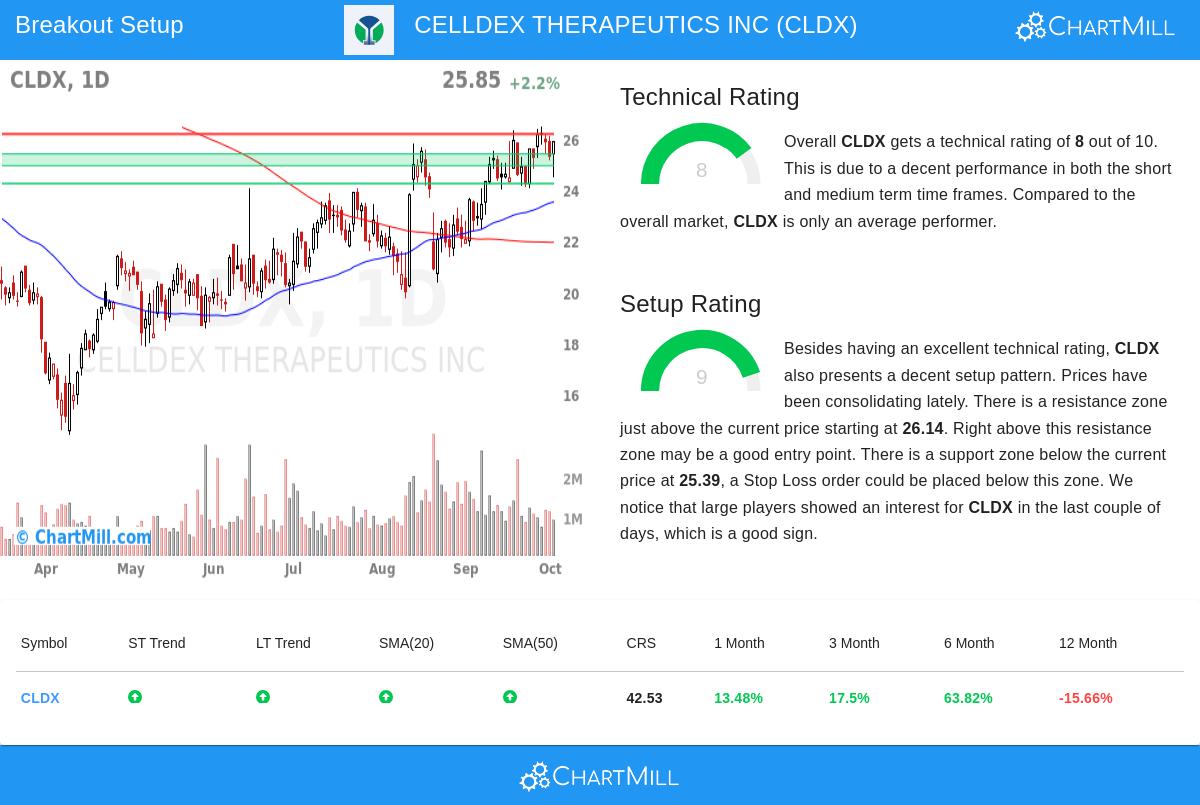
CELLDEX THERAPEUTICS INC (NASDAQ:CLDX) shows good technical features with a Technical Rating of 8 out of 10. This rating shows several positive technical points that match the breakout strategy's need for stocks with clear upward momentum. The technical review shows a number of strong points:
- Both short-term and long-term trends are positive, showing continued buying interest across various timeframes
- The stock trades above important moving averages including the 20-day SMA at $24.93, 50-day SMA at $23.51, and 100-day SMA at $22.25
- Recent performance shows good momentum with increases of 13.48% over one month and 63.82% over six months
- Average daily volume of 1.33 million shares gives sufficient liquidity for position entry and exit
These technical points are important because the breakout method focuses on stocks with clear upward trends, as they are more likely to keep their momentum after consolidation periods. The mix of positive trends across several timeframes and position above important moving averages points to institutional support and possible lasting price growth.
Setup Quality and Consolidation Pattern
Beyond its good technical base, CLDX shows a very good setup pattern with a Setup Rating of 9 out of 10. This high score means the stock has been trading in a narrow consolidation range, creating conditions good for a possible breakout. The setup review shows several notable features:
- Prices have been moving within the $22.43 to $26.46 range over the past month, with current trading near the upper part of this range
- A clear resistance zone is found between $26.14 and $26.19, made by several trendlines across weekly and daily timeframes
- Strong support exists at $25.39, formed by a mix of trendlines and moving averages
- Recent unusual activity by large investors, as measured by the Effective Volume indicator, points to institutional accumulation
The consolidation pattern is especially important for breakout strategies because it shows a time of balance between buyers and sellers. As volatility decreases during these times, the next increase often leads to notable directional moves. The nearness to resistance with strong support below creates a good risk-reward situation for technical entries.
Trading Setup Considerations
The technical analysis report indicates a possible trading setup based on the present technical arrangement. A breakout above the $26.20 level could signal continuation of the upward trend, with initial resistance at the $26.14-$26.19 zone. The close support at $24.92 gives a logical level for stop-loss placement, creating a measured risk situation. The space between possible entry and stop levels is about 4.89% of the stock's value, allowing for suitable position sizing based on personal risk tolerance.
While the automated setup gives a structure, traders should note that the space between suggested entry and exit points is somewhat small compared to CLDX's average daily movement of 4.32%. This could require changes based on personal trading styles and risk settings. Also, the biotechnology sector's natural volatility and sensitivity to clinical trial results and regulatory news calls for careful watching of fundamental news along with technical points.
For investors looking for similar technical breakout chances, more screening results can be found using the Technical Breakout Setups screener, which regularly updates with new possible setups meeting the combined standards of good technical ratings and high setup quality.
Disclaimer: This analysis is for informational purposes only and does not constitute investment advice, recommendation, or endorsement of any security. Trading stocks involves substantial risk and may not be suitable for all investors. Always conduct your own research and consider consulting with a qualified financial professional before making investment decisions.