
Technical investors often look for stocks showing both good existing momentum and clear consolidation patterns that indicate possible breakouts. One methodical process involves filtering for securities with high technical ratings, which assess overall trend condition, together with high setup quality scores that find periods of price consolidation. This approach focuses on stocks that not only show continued upward movement but also offer specific entry and exit points, limiting emotional choices during unstable market periods.
COGNEX CORP (NASDAQ:CGNX) appears as a notable candidate from such filtering methods. The industrial machine vision company shows features that fit with technical breakout plans, displaying both good trend force and helpful price consolidation.
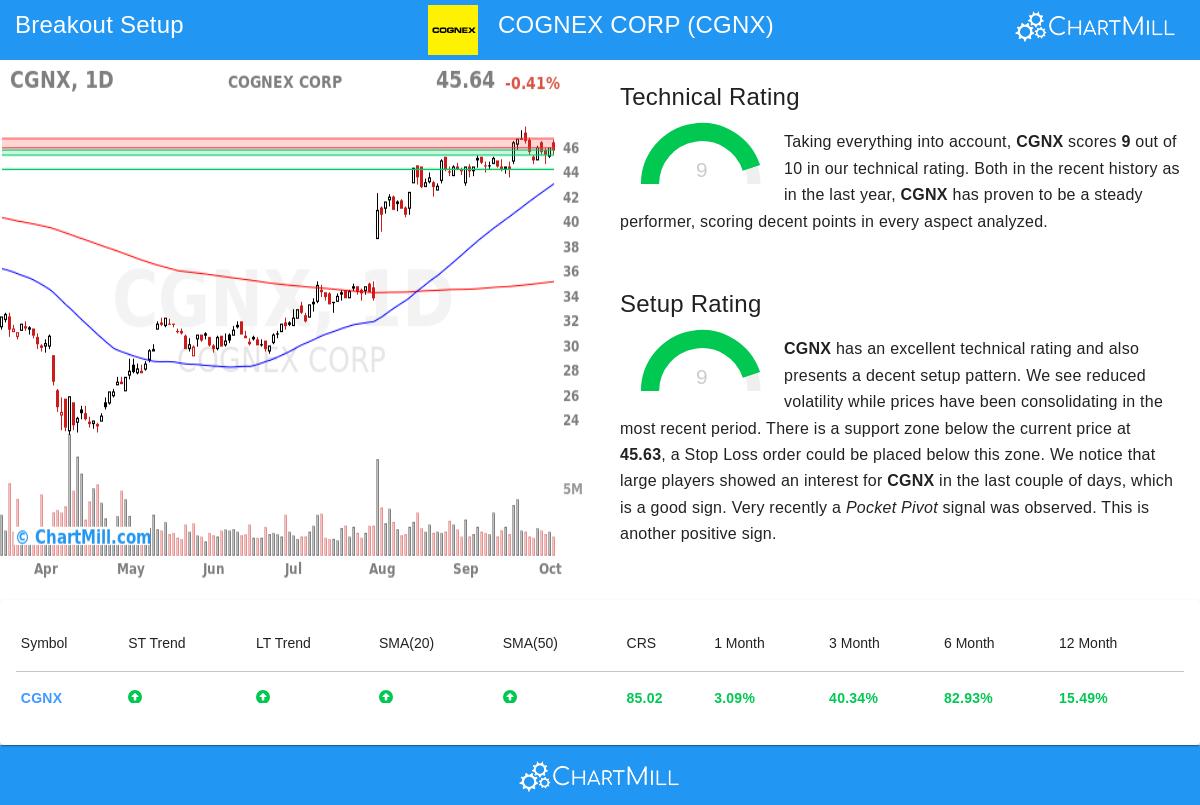
Technical Strength Assessment
Cognex's technical base looks especially firm based on the ChartMill Technical Analysis report, which gives the stock a rating of 9 out of 10. This high rating shows several good technical factors:
- Both short-term and long-term trends are positive, showing agreement across different time periods
- The stock trades close to its 52-week high of $47.52, showing continued upward momentum
- Price holds above important moving averages (20-day: $45.21, 50-day: $42.90, 200-day: $35.03)
- Relative strength is better than 85% of all stocks in the market
For breakout traders, these technical features give assurance that the stock is within a steady uptrend, an important base for successful breakout trades. The agreement across multiple time periods indicates the momentum has staying power instead of being a brief surge.
Setup Quality Evaluation
Apart from good technicals, Cognex shows a setup quality rating of 9, meaning the stock has moved into a helpful consolidation stage. A few elements add to this high setup score:
- Price movement has tightened within a specific range between $43.42 and $47.52 over the last month
- Several support levels are below the current price, with the strongest group between $45.21-$45.63
- Lower volatility sets up the chance for a possible clear breakout move
- Recent pocket pivot signals and institutional accumulation point to underlying force
The consolidation pattern lets technical traders find clear risk limits, with support areas giving logical levels for stop-loss orders. The lower volatility during this consolidation often comes before notable price moves when breakouts happen.
Trading Considerations
The technical analysis indicates a possible breakout above the $46.56 resistance level, which would be a significant move above the present consolidation range. If this happens, the next major support is at $45.20, creating a specific risk limit of about 2.9%. The existence of several support levels below this price gives more assurance in the risk management plan.
For investors using position sizing plans, the fairly close risk limits could permit suitable position sizing while keeping controlled portfolio risk. The stock's average daily volume over 2 million shares gives enough liquidity for effective trade execution.
Market Context
Cognex's technical force matches the wider market situation, where the S&P 500 holds positive trends in both short-term and long-term timeframes. This relationship indicates the stock's performance shows both company-specific force and helpful market circumstances rather than moving against the main market direction.
Readers wanting to find more technical breakout possibilities can check the Technical Breakout Setups screen for daily updated candidates meeting similar technical and setup conditions.
Disclaimer: This analysis is based on technical indicators and historical price patterns and should not be considered investment advice. Trading involves substantial risk, and past performance does not guarantee future results. Always conduct your own research and consider your risk tolerance before making investment decisions.