
For investors using a systematic method to find high-growth market leaders, the CANSLIM approach, created by William O'Neil, stays a key strategy. It joins careful fundamental study with technical timing, concentrating on companies showing solid earnings speed, high relative strength, and institutional support, all during a positive market phase. This structured method is made to find stocks with a chance for major price gains.
A recent scan using main CANSLIM filters has identified CECO ENVIRONMENTAL CORP (NASDAQ:CECO) as a candidate for more review. The Texas-based company offers important engineering technology and answers for industrial air, water, and energy shift markets worldwide. We will look at how CECO fits the main parts of the CANSLIM system.
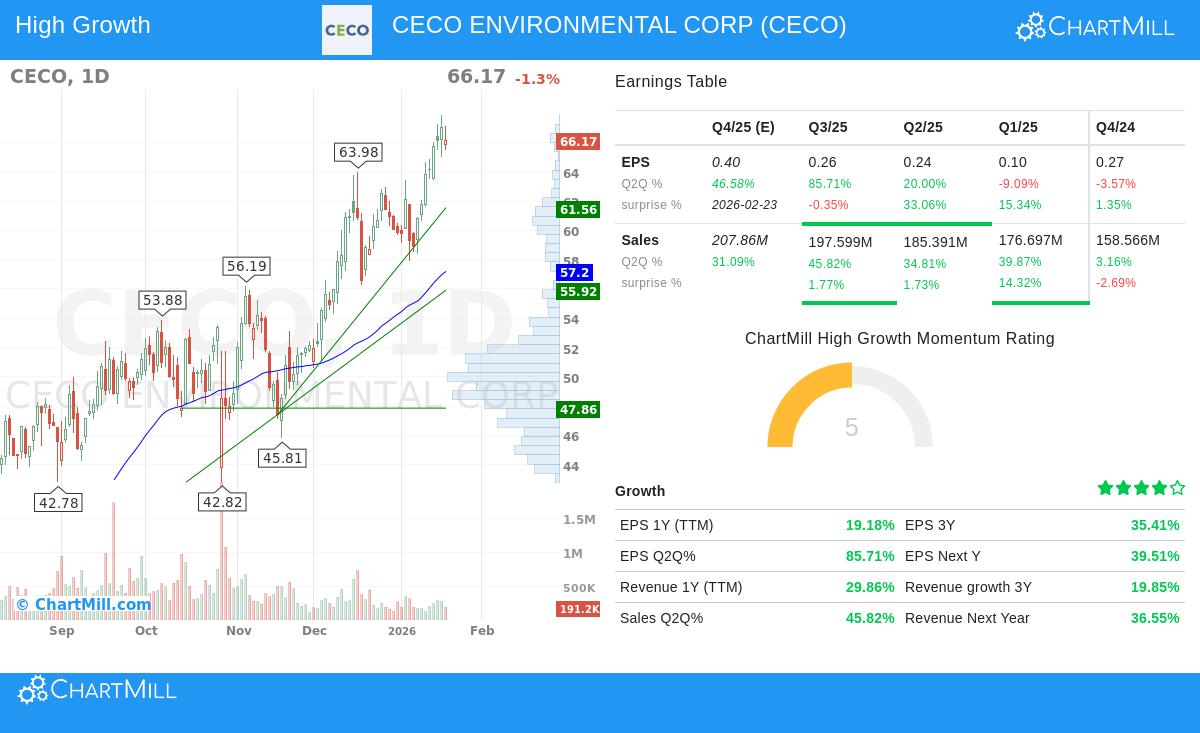
Fitting the CANSLIM "C" and "A" Rules: Earnings & Yearly Growth
The "C" in CANSLIM calls for solid current quarterly earnings and sales growth, preferably with increasing speed. The "A" needs a record of major yearly earnings gains. CECO shows notable numbers here:
- Quarterly EPS Growth (Q2Q): 85.7%
- Quarterly Sales Growth (Q2Q): 45.8%
- 3-Year EPS CAGR Growth: 35.4%
- Return on Equity (ROE): 16.8%
These numbers are important to the plan because they show a company that is not only growing quickly but is also effectively creating profits from shareholder equity. CECO's high quarterly growth, especially in earnings per share, is much greater than the usual CANSLIM minimum of 20-25%, showing strong recent movement. The solid 3-year growth rate and a good ROE above the 10% level indicate this is not a single-quarter event but part of a longer-term profitable rise.
Matching "L," "I," and "S": Leadership, Support, and Supply
CANSLIM looks for market leaders with institutional interest and a reasonable capital structure.
- Relative Strength (L): 95.8
- Institutional Ownership (I): 83.0%
- Debt-to-Equity Ratio (S): 0.71
A relative strength score of 95.8 means CECO's price performance has beaten almost 96% of all stocks over the last year. This is a sign of a market leader, a key "L" rule, as it shows the stock is already wanted. The institutional ownership level of 83% confirms professional investor attention while staying below the 85% level often used to prevent overly common trades. The debt-to-equity ratio of 0.71 is seen as acceptable and is lower than the scan's filter of 2, meeting the "S" for supply by showing the company is not over-burdened with debt.
Technical and Fundamental Overview
A check of CECO's separate reports gives a united view. The technical analysis report gives a top score of 10/10, stating both long-term and short-term trends are good. The stock is trading near its 52-week high and shows high relative strength against both the wider market and its industrial machinery group. The report does note that recent price swings may need waiting for a clearer pause pattern for a better entry point.
The fundamental analysis report gives a more varied but growth-centered view, with a total score of 4/10. It points out CECO's very good growth picture, with solid past revenue gains and even faster earnings growth predicted next. However, it mentions worries about financial condition, mainly liquidity ratios, and notes the current price as high based on standard price-to-earnings measures. This split is frequent in high-growth CANSLIM candidates, where high prices are accepted for faster future earnings.
A Candidate for More Review
CECO Environmental Corp shows a solid fit with several number-based parts of the CANSLIM plan: high quarterly growth, top relative strength, and institutional attention. Its technical position is strong, trading in a confirmed upward trend. While fundamental price measures cause concern, the system's center is on growth movement and price behavior, often accepting higher valuations.
For investors using this method, CECO is a notable example of the kind of stock the scan is made to find, a company displaying speeding fundamentals while its price action confirms institutional buying. As usual, the last "M" for market direction is vital; the current good short-term trend for the S&P 500 gives a supportive setting for reviewing such growth-focused ideas.
Find More CANSLIM Ideas This review of CECO came from a set CANSLIM scanning setup. You can run this scan yourself and see all current market candidates that meet these exact growth and movement rules by going to the O'Neill CANSLIM High Growth scan.
,
Disclaimer: This article is for information and learning only and is not investment advice, a suggestion, or an offer or request to buy or sell any securities. The study shown is based on data and a specific investment method; it is not a replacement for your own separate research and judgment. You should think about your own money situation, investment goals, and risk comfort before making any investment choice.