
For investors looking for a systematic way to find high-growth market leaders, the CANSLIM method, created by William O'Neil, offers a clear framework. This strategy mixes detailed fundamental study with important technical signs to find stocks with solid earnings momentum, institutional support, and leading traits, all while stressing the need to understand the general market trend. The aim is to find companies not only with good financials, but with the price movement that shows the market concurs.
Cadre Holdings Inc (NYSE:CDRE) recently appeared from a screen based on central CANSLIM ideas. As a maker of safety and survivability gear for law enforcement, military, and first responders, its business model is simple, but its recent financial numbers tell a more active story.
Reviewing the CANSLIM Criteria
A detailed review of Cadre Holdings shows how it matches several parts of the CANSLIM system:
-
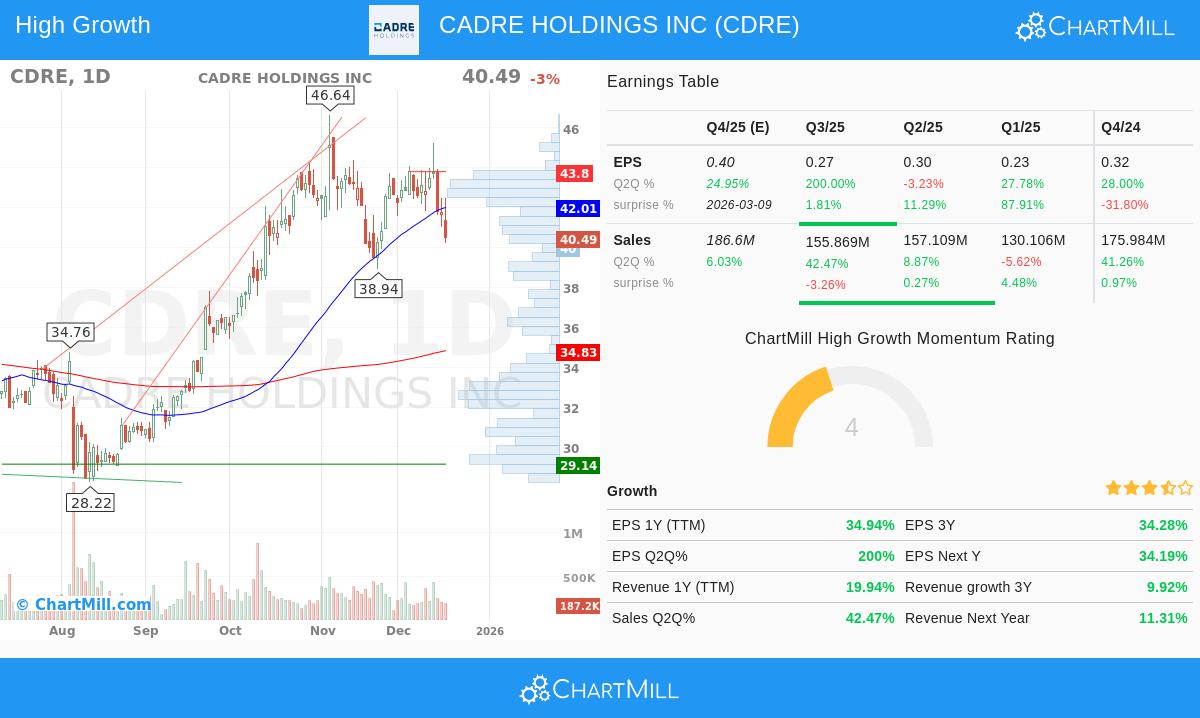
Current Quarterly Earnings & Sales (The "C"): This is where CDRE is most notable. The company reported a very high 200% year-over-year earnings per share (EPS) growth for its latest quarter, well above the common CANSLIM target of 18-25%. Also, quarterly sales growth was a solid 42.5%. This fast rise in both profit and revenue is a main sign the CANSLIM method looks for, showing strong business momentum.
-
Annual Earnings Increases (The "A"): Strong recent quarters need a history of performance. CDRE shows this with a 3-year EPS compound annual growth rate (CAGR) of 34.3%, above the 25% mark. The company also shows a good Return on Equity (ROE) of 13.3%, which is higher than the 10% minimum and points to efficient use of shareholder money.
-
Supply, Demand, and Financial Health (The "S" & "L"): On supply, CDRE has a moderate Debt-to-Equity ratio of 0.87, which is under the screen's limit of 2, indicating a balanced sheet. On demand and leadership, the stock has a high Relative Strength (CRS) of 84.53. This means it has done better than about 85% of the market, a key technical feature of a market leader that the "L" in CANSLIM requires.
-
Institutional Sponsorship (The "I"): Institutional ownership is at 73.6%, which is below the 85% maximum used in the screen. This indicates there is still potential for more institutional purchases, which can give continued demand and support for the stock's story.
Fundamental and Technical Overview
The given fundamental analysis report gives CDRE a score of 6 out of 10. The summary points out a company with notable profitability and good growth, but mentions some small issues with financial health. The valuation seems fair compared to its industry, though its P/E ratio is high in general terms, which is common for high-growth companies.
From a technical view, the stock gets a good score of 8 out of 10. The long-term trend is positive, and the stock is trading in the higher part of its 52-week range. However, the analysis states that while the setup is not perfect for a new purchase now due to recent price changes, the basic technical strength fits a leading stock. Investors can see all the details in the fundamental analysis and technical analysis reports.
Market Setting and Final Points
The "M" in CANSLIM, Market Direction, stays a vital, overall element. The present setting has a neutral long-term trend for the S&P 500 with a positive short-term leaning. CANSLIM supporters are most involved during clear bullish market periods, so any investment thought must be balanced with the wider market's condition.
Cadre Holdings makes a strong case for investors using a growth-focused, CANSLIM-based approach. It shows the fast quarterly earnings growth, good annual trends, better market-relative strength, and acceptable institutional sponsorship that the method values. While its valuation and recent price swings need notice, the fundamental momentum is evident.
This stock was found using a set CANSLIM screening setup. You can check the current market for other stocks that fit similar high-growth standards by using the CANSLIM stock screener.
Disclaimer: This article is for information and learning only and is not a suggestion to buy, sell, or keep any security. The analysis uses given data and certain screening filters. Investing has risk, including the possible loss of money. You should do your own complete research and think about talking with a qualified financial advisor before making any investment choices.