
A systematic approach to stock selection often combines strict technical criteria with fundamental growth metrics to find possible leaders. The method used here applies Mark Minervini's Trend Template to sort for stocks showing solid, confirmed uptrends, making sure they are in a good technical state. This is then combined with a High Growth Momentum (HGM) screen, which looks for companies showing speeding earnings and sales growth, a sign of the fundamental force that often supports continued price gains. This two-step filter plan tries to find securities where forceful technical momentum is supported by sound basic business results.
CNB Financial Corp/PA (NASDAQ:CCNE) results from this screening process, offering a case for more review by investors using a growth-focused, momentum-based plan.
Technical Fit with the Minervini Trend Template
The center of Minervini's plan is to invest in the direction of confirmed force, staying away from turnaround situations and concentrating on stocks already in a Stage 2 advance. The Trend Template gives a clear list to describe this force. A look at CCNE's chart and moving averages shows it passes the main technical limits:
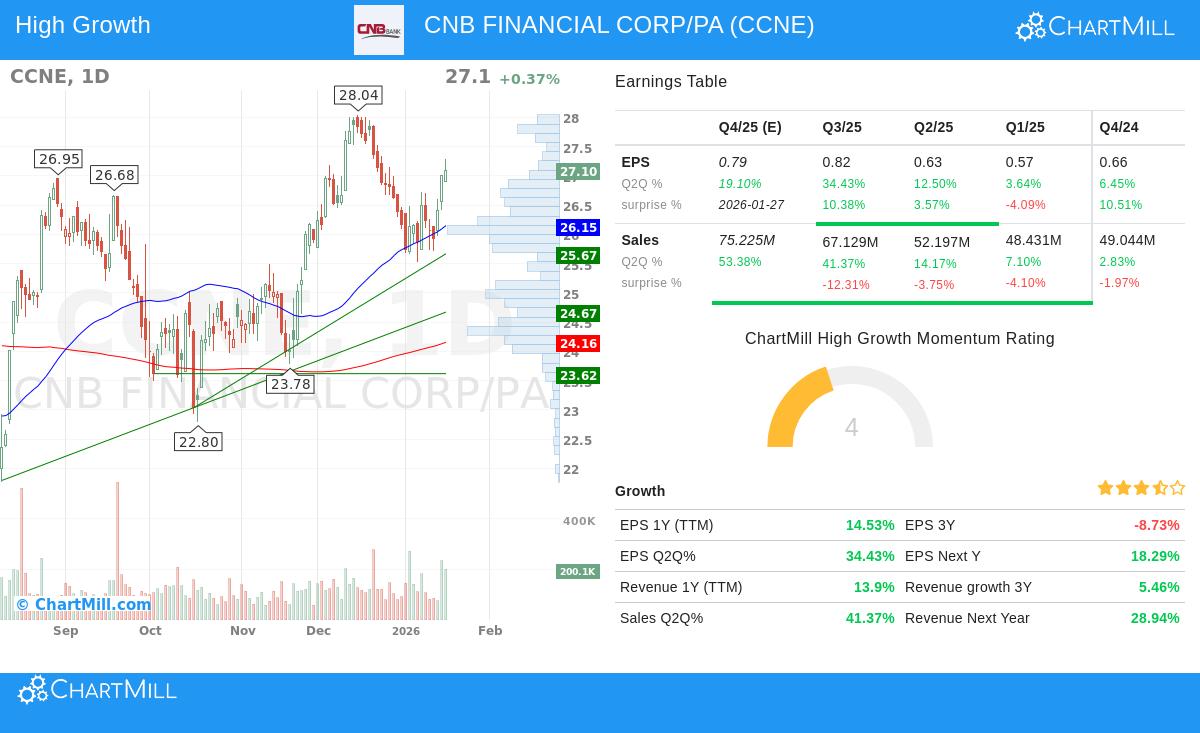
- Trading Above Important Averages: The stock's present price trades above its rising 50-day, 150-day, and 200-day simple moving averages (SMAs). This order shows continued buying interest across short, medium, and long-term periods.
- Moving Average Order: The 50-day SMA ($26.15) is above both the 150-day ($24.91) and 200-day ($24.16) SMAs, while the 150-day SMA is also above the 200-day. This "stacked" order is a standard mark of a sound, speeding uptrend.
- Nearness to Highs: CCNE's price is about 40% above its 52-week low of $19.32 and within 3.4% of its 52-week high of $28.04. This meets the template's need to be at least 30% off the low and within 25% of the high, focusing on force instead of deep-value opportunities.
- Relative Strength: With a ChartMill Relative Strength (CRS) ranking of 74.3, the stock does better than almost three-quarters of the market. While Minervini often looks for readings above 80 for true leadership, a ranking above 70 meets the basic requirement and implies the stock is not falling behind the wider market's positive trend.
This technical picture implies CCNE is not in a basing or falling stage but is actively taking part in an uptrend, which is the necessary base for the plan.
Fundamental Argument for High Growth Momentum
Technical force is most convincing when it is verified by getting better fundamentals. The High Growth Momentum filter looks for proof of speeding business results, which can act as the reason for more price gains. CCNE shows several positive fundamental data points:
- Earnings Speed Increase: The newest quarterly EPS growth year-over-year is a solid 34.4%, a notable speed increase from the 12.5% and 3.6% growth seen in the two earlier quarters. This pattern of improving quarterly growth is a main sign for momentum investors.
- Sound Sales Growth: Revenue growth has also turned positive, with the last quarter showing a 41.4% increase compared to the same time last year. This goes past the growth rates of the previous quarters and shows top-line momentum.
- Positive Estimate Changes: Analysts have slightly raised their earnings estimates for the next fiscal year over the past three months. Upward changes often show growing belief in a company's view and can be a sign of institutional buying.
- History of Beating Estimates: The company has beaten EPS estimates in three of the last four quarters, with an average beat of over 5%. Steady earnings surprises can build investor belief and lead to repeated re-ratings of the stock.
These parts are important because, as Minervini's SEPA (Specific Entry Point Analysis) method notes, the biggest stock market winners are almost always backed by solid and speeding earnings and sales growth. The fundamental improvement gives a reason for the technical breakout, implying the momentum may have a lasting base.
Technical Condition and Setup Review
ChartMill's own analysis gives a summary of CCNE's technical condition. The stock gets a Technical Rating of 6 out of 10, described as an average performance. The report states that both the short-term and long-term trends are positive, and the stock trades in the higher part of its 52-week range. However, it also says that the recent trading range has been fairly wide and the present Setup Quality rating is low (3 out of 10), meaning that price action has been too unstable to find a high-chance, low-risk entry point at this time. For a trader closely following Minervini's rules, this implies a need for patience, waiting for the stock to form a tighter consolidation or a clear volatility contraction pattern (VCP) before thinking about an entry.
A full breakdown of support and resistance levels, with the complete analysis, is in the ChartMill Technical Report for CCNE.
Conclusion
CNB Financial Corp (CCNE) offers an interesting case where a strict screening process finds fit with both momentum and growth requirements. The stock meets the mechanical needs of the Minervini Trend Template, confirming its part in a wider market uptrend with positive relative strength. Fundamentally, it shows marks of speed increase in main growth metrics, especially in its newest quarterly earnings and sales numbers, which is exactly the type of reason the High Growth Momentum screen tries to find.
The present technical review implies that while the trend is whole, the immediate setup may not be best for a new entry, noting the importance of the final, choice step in any plan: reviewing the individual chart for a specific, low-risk entry point. For investors using this combined method, CCNE earns a place on a watchlist for possible chances should it form a more constructive price pattern.
Interested in finding other stocks that pass this combined screen of Minervini trend and high-growth fundamentals? You can review the present results using the High Growth Momentum + Trend Template screen on ChartMill.
,
Disclaimer: This article is for informational and educational purposes only. It is not a recommendation to buy or sell any security. The analysis is based on data provided and certain screening methodologies. All investing involves risk, including the potential loss of principal. You should conduct your own research and consult with a qualified financial advisor before making any investment decisions.