
For technical investors, finding stocks that are in a solid uptrend and ready for their next advance is a central task. One way to address this is by using a method that looks at both the basic technical condition of a stock and the state of its present price formation. This tactic frequently includes searching for stocks with high technical scores, pointing to a firm, confirmed uptrend, and high setup scores, which mark a time of constructive pause that might come before an upward move. By concentrating on securities that rate well on both measures, traders try to place themselves in solid market leaders just as they start a new period of upward movement.
A recent search using this approach has identified CBRE GROUP INC - A (NYSE:CBRE) as a stock showing these traits. As a top global firm in commercial real estate services and investment, the company's stock is now displaying a chart formation that technical traders may find interesting.
Examining the Technical Base
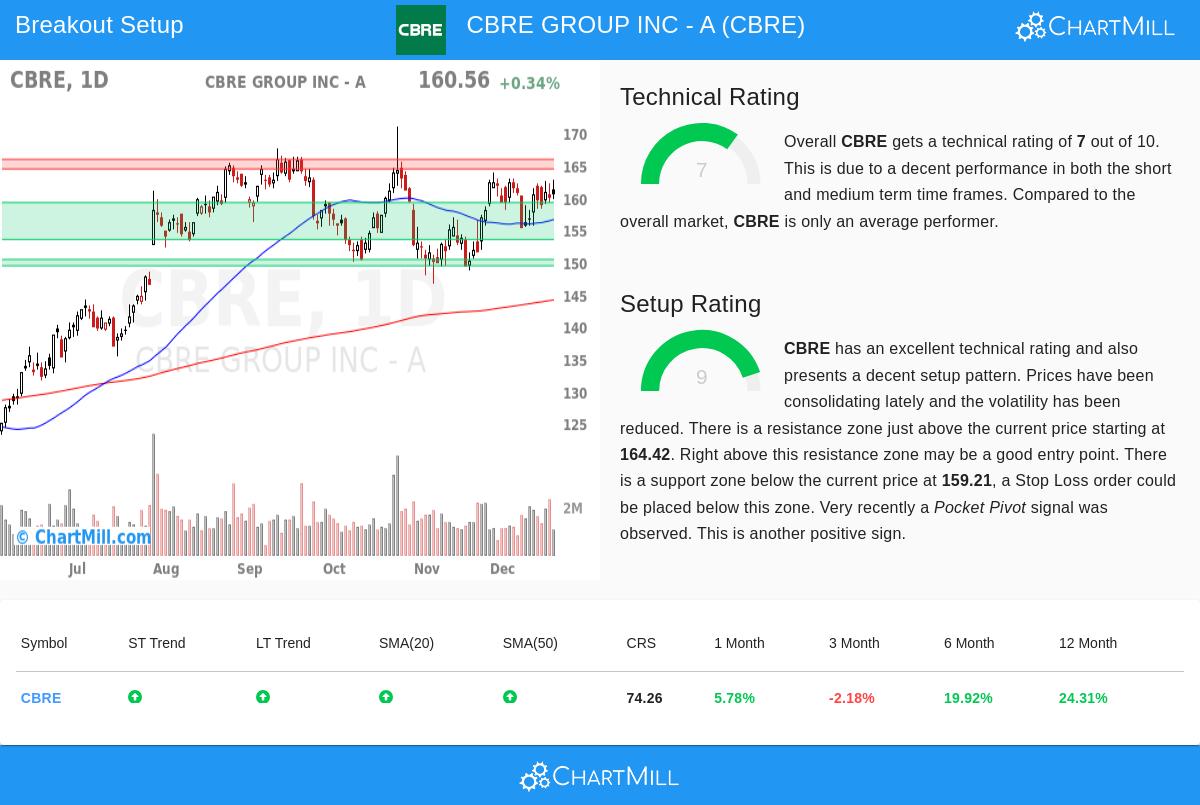
The first part of this tactic is confirming the stock is in a technically sound state, which is measured by ChartMill's Technical Rating. A score of 7 or more usually means a stock is in a verified uptrend. CBRE presently has a Technical Rating of 7, which is explained in its full technical report.
This score is backed by a number of good elements seen in the market:
- Trend Agreement: Both the long-term and short-term trends for CBRE are scored as positive. This agreement across different periods is a standard indicator of a sound trend, lessening the disagreement that can happen when shorter-term actions go against the main direction.
- Moving Average Backing: The stock is priced above its important moving averages, which include the 20, 50, 100, and 200-day Simple Moving Averages (SMAs). Also, all these averages are themselves in rising arrangements, forming a tiered support base under the price.
- Relative Strength: While the stock does better than 74% of similar companies in the Real Estate Management & Development field, the report mentions its performance has been somewhat focused around a solid move a few months back. Still, trading in the higher part of its 52-week range confirms its place in a wider uptrend.
This firm technical base is important for the tactic because it raises the chance that any upward move from a pause formation will keep going in the direction of the confirmed trend, instead of stalling or turning down.
Looking at the Setup Condition
A solid trend by itself is not a signal to buy; getting in at a high price can result in quick declines. This is where the second measure, the Setup Quality Rating, becomes key. It finds times of pause or "narrow" price movement, which often give lower-risk chances to enter. CBRE has a high Setup Rating of 9.
The present chart formation shows this high score through several main features:
- Pause in a Band: Over the last month, CBRE has moved between about $151.50 and $163.90. This time of lateral movement after earlier rises lets the stock ease high conditions and form a new base of support.
- Clear Support and Resistance: The pause has created definite technical points. A notable support area is found between $153.50 and $159.20, made by a combination of moving averages and trendlines. On the other side, close overhead resistance is in a narrow band between $164.40 and $165.90.
- Lowered Instability and Good Indicators: The report notes lowered instability during this pause phase, a common trait before a clear move. Also, a recent "Pocket Pivot" signal—a price move with higher volume pointing to buying—adds a good detail to the setup.
This high-condition setup is necessary as it gives a trader clear, specific points for arranging a trade: a possible entry point for an upward move just above resistance and a sensible stop-loss point below the support area, clearly setting the risk.
A Possible Trade Plan
From this review, the technical report proposes a specific, though automatic, trade plan. The suggested setup includes placing a buy-stop order at $165.92, just above the noted resistance band, to confirm an upward move is starting. A stop-loss order would then be placed at $155.15, below the recent pause support. This plan confines the theoretical risk on the trade to about 6.5% of the entry price. It is a standard case of how the mix of a solid technical score (the "which") and a high-condition setup (the "when") can turn into a specific tactical plan.
Find Other Possible Upward Move Setups The method used to find CBRE is used each day across the market. Investors searching for a selected list of stocks now displaying similar solid technicals and high-condition setups can locate them by going to the Technical Breakout Setups screen.
Disclaimer: This article is for information only and is not investment advice, a suggestion, or an offer or request to buy or sell any securities. The trade plan shown is an automatic, theoretical example built on technical indicators and is not a promise of future results. All investing and trading has risk, including the possible loss of the amount invested. Always do your own research, think about your money situation and risk comfort, and talk with a registered financial advisor before making any investment choices.