
Combining basic strength with price movement can be a good method for finding possible investments. This method looks for companies with solid basic business expansion and sound finances that are also showing positive price behavior, indicating the market sees their quality. By looking for stocks with good expansion traits that are also moving out of technical formations, investors try to join the price movement of a stock as its basic situation gets more attention. CBRE Group Inc - A (NYSE:CBRE) appears as a stock that now matches this particular method.
Fundamental Expansion Evaluation
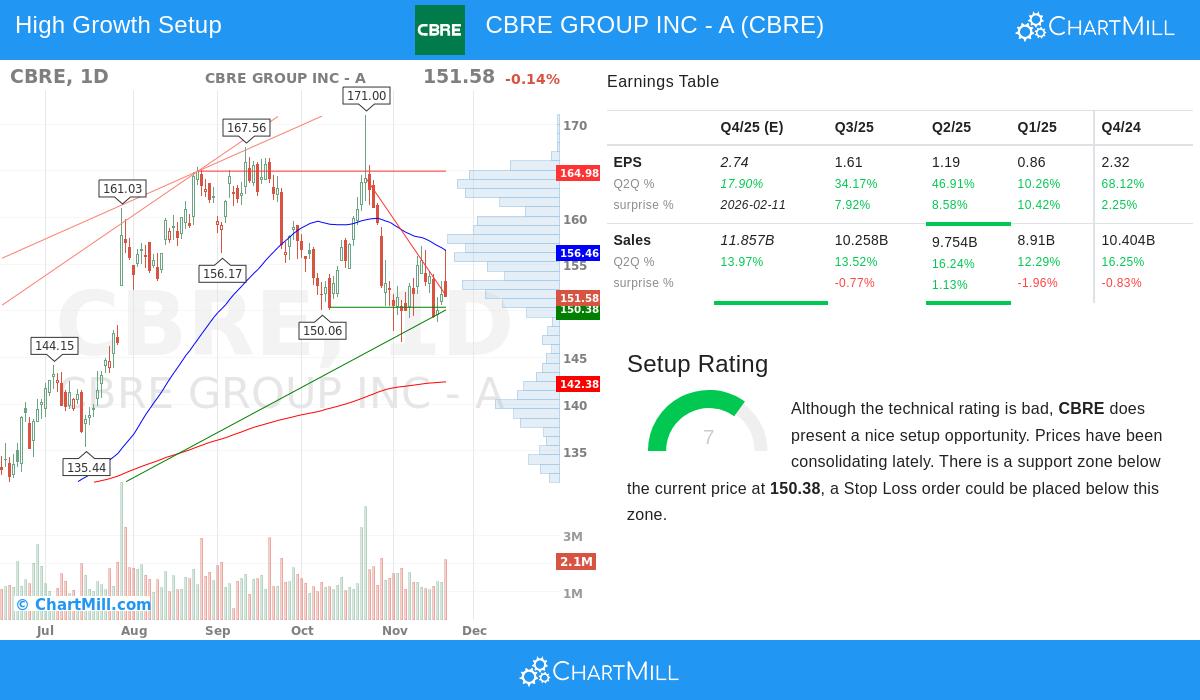
The center of this method starts with finding companies showing notable expansion, and CBRE's basic profile displays encouraging signals here. The company's expansion rating of 7 out of 10 is backed by firm past and expected growth.
- Revenue Expansion: The company reported a 14.61% rise in revenue over the last year, with an average yearly growth rate of 8.40% over several years. Future predictions indicate this movement will keep going, with revenue anticipated to grow at 9.02% per year.
- Earnings Per Share (EPS) Expansion: EPS saw a large 43.41% rise in the last year. While the multi-year average is a more measured 6.61%, analysts forecast a speed-up to almost 18% yearly growth in the next few years.
- Speeding Up Expansion: The basic report states that the EPS growth rate is getting faster, a main trait wanted by expansion investors as it signals better business conditions.
This good expansion profile is important for the method because it finds companies that are getting bigger quicker than their competitors, a main idea of expansion investing. A company cannot keep up a technical move-out without a good basic situation to back it. You can check all the information in the Fundamental Analysis Report for CBRE.
Supporting Financial Condition and Earnings
While expansion is the main force, the method also needs acceptable financial condition and earnings to make sure the company is on a lasting course. CBRE shows a steady profile here, lessening some of the dangers often linked with high-expansion investments.
- Earnings: With a rating of 6, the company shows steady earnings. Important measures like its Return on Equity (14.39%) and Return on Invested Capital (6.76%) do better than a large part of its industry competitors.
- Financial Condition: The condition rating of 5 shows a normal but steady money position. The company has a firm Altman-Z score of 3.46, pointing to a low short-term danger of money trouble, and has been lowering its share count over time.
These points are key as they give a safety buffer. A company with good expansion but poor finances is open to economic drops or operational mistakes. CBRE's acceptable scores in condition and earnings indicate it has the operational steadiness to possibly carry on its expansion path.
Technical Formation and Market Situation
The basic situation is only one part of the matter; the technical view gives the timing tool. CBRE's technical formation rating of 7 out of 10 points to a possibly good chart shape forming after a time of sideways movement.
- Sideways Movement Phase: The stock has been changing hands in a wide band over the last month, between about $146 and $165. It is now moving sideways in the center of this band, which can sometimes come before a clear price change.
- Support and Resistance: A main support area has been found between $149.40 and $150.38, made by several trendlines. A firm support level gives a sensible area for a danger control stop-loss order. The close-by resistance sits just above the present price, between $151.63 and $156.46.
- Long-Term Direction: The long-term direction for CBRE stays positive, which matches the optimistic basic expansion story. While the short-term direction is neutral, the sideways movement inside a longer-term upward direction can be seen as a stop before a possible continuation.
This technical setup is exactly what the looking method searches for: a basically sound expansion stock that is sitting inside a price band, possibly preparing for a move-out. For a closer look into the chart shapes and levels, see the Technical Analysis Report for CBRE.
Valuation Background
Valuation is always an important thought. CBRE shows a mixed picture, with a neutral total valuation rating of 5. Its Price-to-Earnings (P/E) ratio is similar to the wider S&P 500. However, when measured against its own industry, which trades at a much higher average P/E, CBRE looks relatively less expensive, doing better than over 74% of its competitors on this measure. Also, its Price/Earnings-to-Growth (PEG) ratio indicates the present valuation might be reasonable, or even interesting, when its expected earnings expansion is included. For an expansion stock, a fair valuation relative to its future possibility is needed to prevent paying too much for that expansion.
Conclusion
CBRE Group presents a good case for investors using an expansion-with-movement method. The company displays good and speeding up basic expansion in both revenue and earnings, backed by acceptable earnings and financial condition. Technically, the stock is moving sideways inside a longer-term positive direction, displaying a formation that often comes before a notable price change. The mix of these points indicates that CBRE's basic expansion situation might be close to getting wider market notice.
This review of CBRE was found using a particular look for good expansion stocks with positive technical formations. If this method fits your investment plan, you can find more possible chances by checking the Strong Growth Stock Technical Setups Screen.
Disclaimer: This article is for informational purposes only and does not constitute investment advice, a recommendation, or an offer or solicitation to buy or sell any securities. The content presented is based on data believed to be reliable, but its accuracy cannot be guaranteed. All investments involve risk, including the possible loss of principal. You should conduct your own research and consult with a qualified financial advisor before making any investment decisions.