
For investors who use charts and price patterns to guide choices, a methodical process can help sort the market's distractions. One process looks for stocks that are both showing technical health and creating an orderly pause pattern, a pairing that frequently comes before a breakout. This tactic centers on two specific metrics: the ChartMill Technical Rating, which judges the general condition and direction of a stock, and the ChartMill Setup Quality Rating, which measures how neat and contained a stock's recent price action has been. The aim is to find leading stocks that are resting after a rise, providing a possible entry with a clear risk point. A recent filter using this process has pointed to Cardinal Health Inc (NYSE:CAH) as a notable candidate.
Technical Health: A High-Ranking Stock
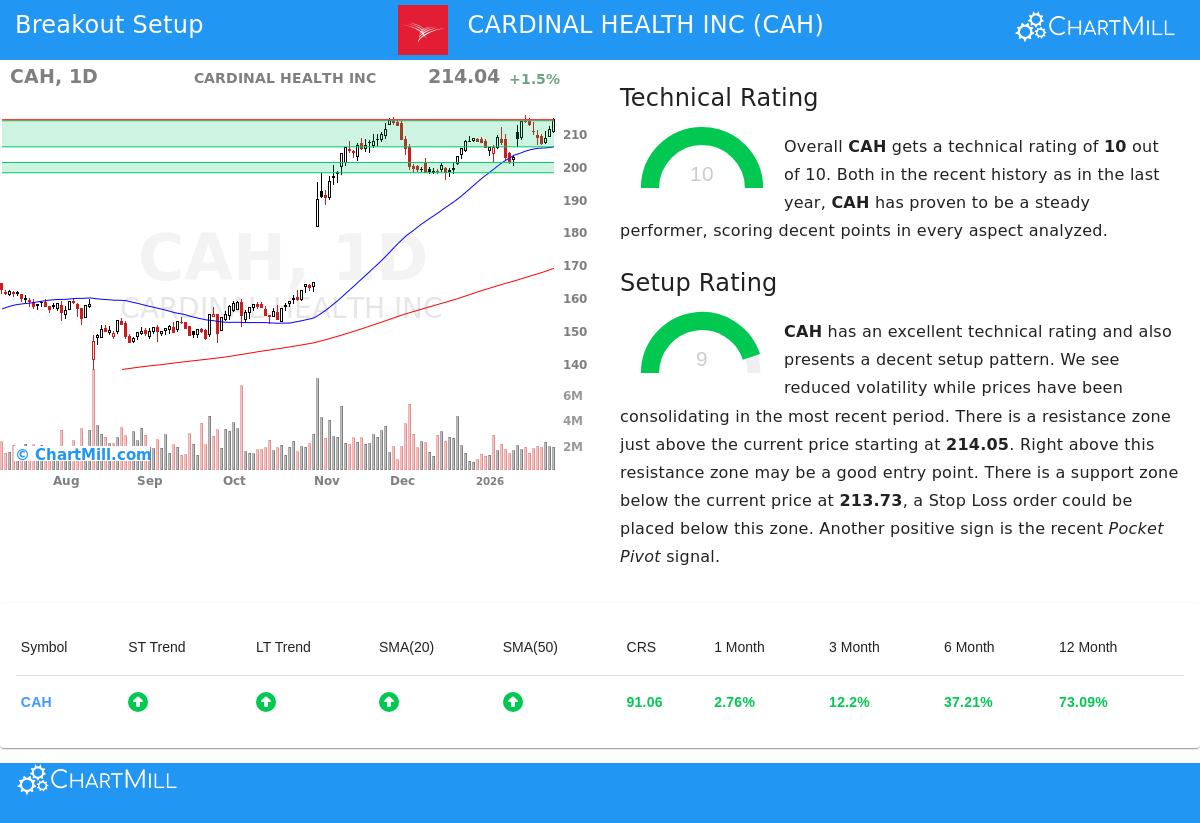
The base of a good breakout pattern is a stock already in a clear uptrend. Cardinal Health’s technical picture is very strong, receiving a top ChartMill Technical Rating of 10 out of 10. This number measures the stock's speed, trend agreement, and comparative results. A look into the full technical report shows the sources of this health.
- Trend Agreement: Both the long-term and short-term trends for CAH are marked as positive. The stock is priced well above its important moving averages (20-day, 50-day, 100-day, and 200-day), all of which are moving up. This multi-level trend agreement is a standard sign of continued positive motion.
- Comparative Results: CAH is not only going up, it is doing better than the wider market. The stock has performed better than 91% of all other stocks over the last year and does better than 91% of similar stocks in the Health Care Providers & Services group. This comparative health is a main sign of large investor interest and leadership.
- Price Level: The stock is now priced close to its 52-week high of $215.48. While the S&P 500 is also near highs, CAH's results match the market's leaders, not just following a general rise.
This top technical rating answers the first important question for a technical trader: "Is this a stock I want to own?" For CAH, the data points to yes. A high technical rating makes sure an investor is looking at market leaders with clear upward motion, instead of trying to buy a declining stock or guess at a turn.
Setup Condition: A Pause Before the Next Move
A strong trend by itself is not a signal to buy, entering after a fast, long rise can be dangerous. The second part is timing, which is where the Setup Quality Rating is key. Cardinal Health gets a 9 out of 10 on this measure, pointing to a good pause pattern.
- Contained Price Action: Over the last month, CAH has been moving between about $199.94 and $215.48. While this span is called "quite wide," the stock is now pausing near the top of this span, with less movement—a signal of balance before a possible next move.
- Clear Support and Resistance: The study finds a specific support area between $205.78 and $213.73, made from a mix of trend lines and moving averages. Just above the present price sits a resistance area at $214.05. This creates a clear technical picture: a move above resistance could signal the beginning of the next upward move, while the support area below gives a sensible place to set a protective stop-loss order.
- Positive Signals: The report also mentions a recent "Pocket Pivot" signal, a price and volume pattern that indicates buying by larger investors, adding another piece of positive data to the pattern.
A high Setup Quality Rating answers the trader's second question: "When should I buy it?" It finds times when a strong stock is resting, forming a base of support, and giving a lower-risk entry point set by nearby support levels. For CAH, the pause near its highs, with clear limits, presents this kind of chance.
A Clear Technical Picture
From this study, a specific, though only example, trading picture appears. The example setup involves setting a buy-stop order at $214.06, just above the noted resistance. A stop-loss order would be set at $205.77, just below the main support area. This sets a risk of about $8.29 per share, or 3.87%. It is important to know this is an automatic example based only on technical levels. Investors must always do their own study, change settings to match their individual risk comfort, and know about fundamental events like coming earnings reports.
Locating Other Possible Breakouts
The filtering process that found Cardinal Health can be used each day to find new chances. For investors wanting to see the current list of stocks showing both high technical health and good setup patterns, the Technical Breakout Setups screen is refreshed often with new results.
Disclaimer: This article is for information only and is not investment advice, a suggestion, or an offer to buy or sell any security. The technical study and trade ideas shown are from automatic measures and past data, which are not promises of future results. Investing has risk, including the possible loss of money. Always do your own research and think about talking with a qualified financial advisor before making any investment choices.