
Our stock screener has flagged BRITISH AMERICAN TOB-SP ADR (NYSE:BTI) as a potential breakout candidate. This occurs when the stock shows signs of consolidation after a notable upward trend. While we can't predict the actual breakout, it's worth monitoring NYSE:BTI for potential movement.
Deciphering the Technical Picture of BTI
ChartMill assigns a Technical Rating to every stock. This score, ranging from 0 to 10, is updated daily and is determined by evaluating multiple technical indicators and properties.
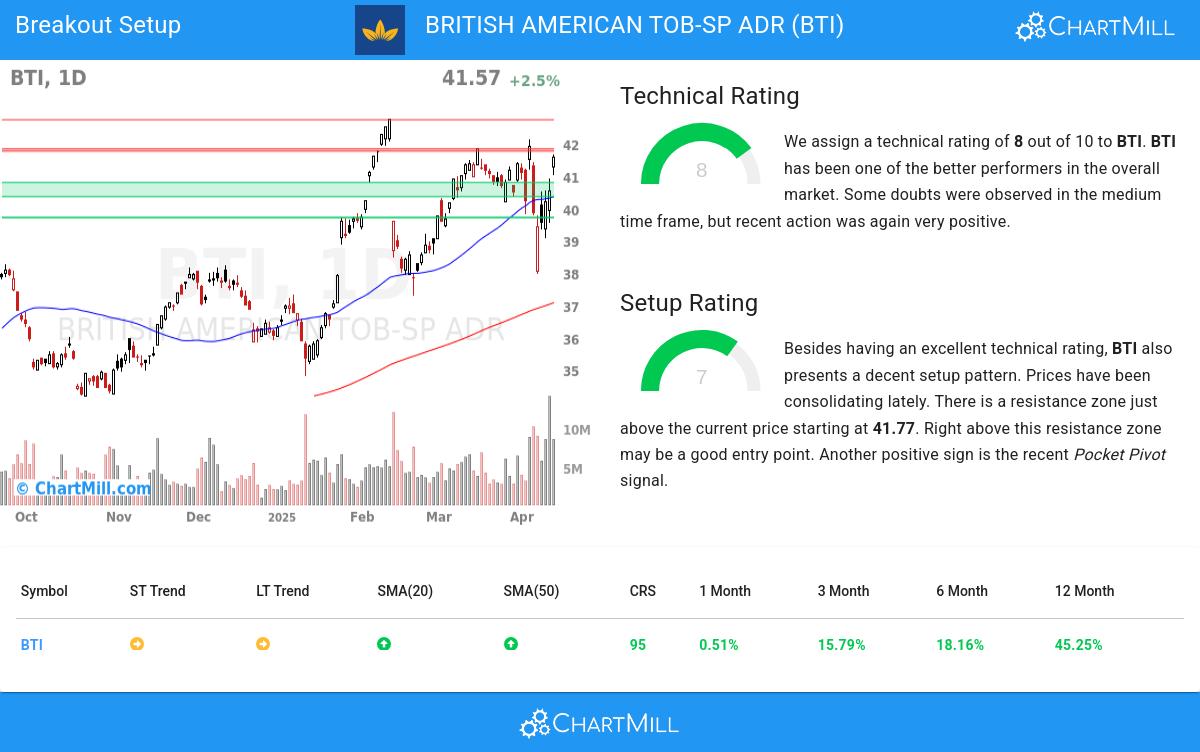
Overall BTI gets a technical rating of 8 out of 10. BTI has been one of the better performers in the overall market. Some doubts were observed in the medium time frame, but recent action was again very positive.
- Looking at the yearly performance, BTI did better than 95% of all other stocks. We also observe that the gains produced by BTI over the past year are nicely spread over this period.
- BTI is part of the Tobacco industry. There are 8 other stocks in this industry. BTI outperforms 71% of them.
- BTI is currently trading near its 52 week high. This is a good sign, certainly because the S&P500 Index is not trading near new highs.
- In the last month BTI has a been trading in the 37.96 - 42.14 range, which is quite wide. It is currently trading near the high of this range.
- Both the short term and long term trends are neutral. So this is not the most entertaining stock around.
- Volume is considerably higher in the last couple of days.
For an up to date full technical analysis you can check the technical report of BTI
How do we evaluate the setup for BTI?
Besides the Technical Rating, ChartMill assigns a Setup Rating to every stock to determine the degree of consolidation. This rating, ranging from 0 to 10, is updated daily and evaluates various short-term technical indicators. BTI currently holds a 7 as its setup rating, suggesting a particular level of consolidation in the stock.
Besides having an excellent technical rating, BTI also presents a decent setup pattern. Prices have been consolidating lately. There is a resistance zone just above the current price starting at 41.77. Right above this resistance zone may be a good entry point. Very recently a Pocket Pivot signal was observed. This is another positive sign.
How to trade BTI?
A breakout opportunity may arise when the stock surpasses the current consolidation zone and reaches new highs. Traders often wait for this breakout before considering buying the stock. To manage risk, a stop loss order could be placed below the consolidation zone to limit potential losses.
This article should in no way be interpreted as trading advice. You should always make your own analysis and trade or not trade based on your own observations and style. The article is based purely on some technical observations.
More breakout setups can be found in our Breakout screener.
Keep in mind
This article should in no way be interpreted as advice. The article is based on the observed metrics at the time of writing, but you should always make your own analysis and trade or invest at your own responsibility.