
For investors looking to mix strict technical discipline with an emphasis on fundamental growth, the method developed by Mark Minervini offers a strong framework. The strategy depends on finding stocks showing both a strong technical uptrend, as described by Minervini's Trend Template, and solid underlying business momentum. This two-step method tries to find companies not only rising on the chart, but doing so because of speeding earnings and sales, a sign of real market leadership. A scan based on this idea, which uses the Trend Template and a High Growth Momentum (HGM) rating, recently identified B2GOLD CORP (NYSEARCA:BTG) as a candidate for more review.
Technical Fit with the Minervini Trend Template
The foundation of Minervini's method is the Trend Template, a group of fixed technical rules made to filter for stocks in a clear, strong Stage 2 advance. B2GOLD's present chart pattern shows a good fit with these rules, which are vital for making sure one is trading with the main trend.
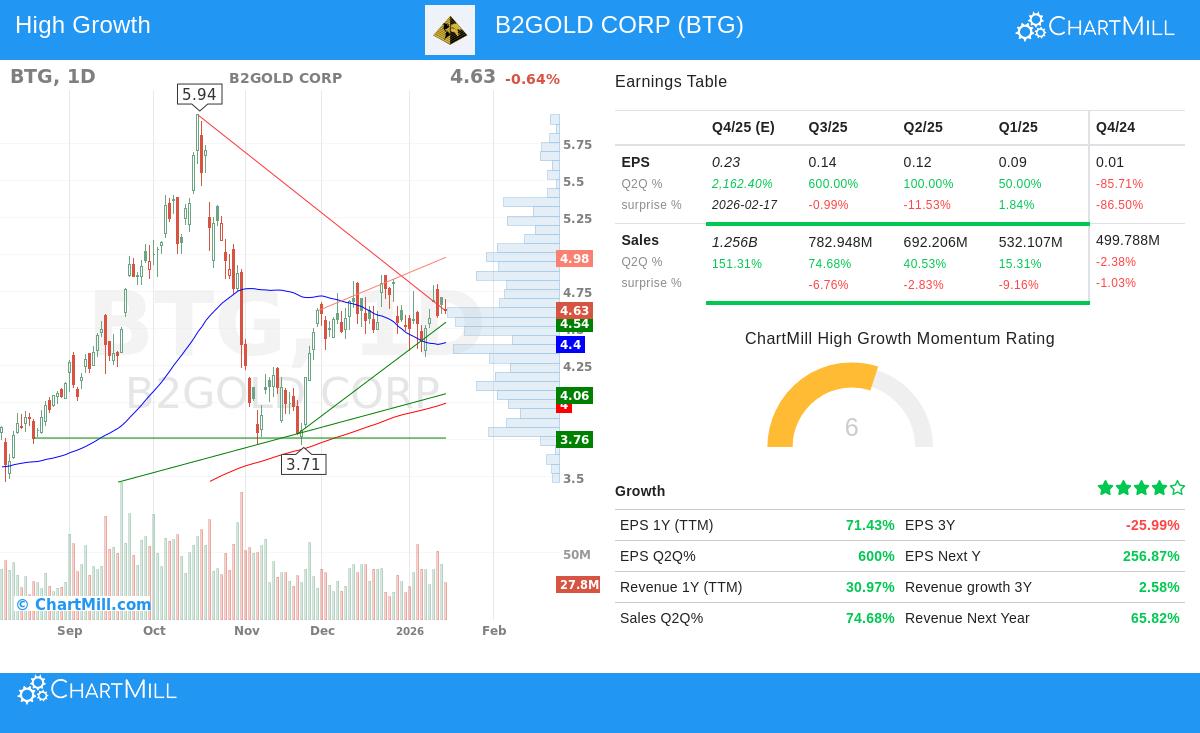
- Moving Average Arrangement: The stock's price is trading above all main moving averages (50-day, 150-day, and 200-day), and, significantly, these averages are ordered in the correct bullish way: the 50-day SMA ($4.40) is above the 150-day SMA ($4.26), which is above the rising 200-day SMA ($3.99). This arrangement points to steady buying pressure across different time periods.
- Nearness to Highs: A central Minervini rule is to concentrate on strength, not weakness. While BTG is not at a new 52-week high, its present price of $4.63 sits well inside the needed 25% range of its high ($5.94). Also, it stays more than 30% above its 52-week low ($2.20), showing it has already made a major recovery and is forming a base for a possible next rise.
- Better Relative Strength: Maybe most revealing is the stock's ChartMill Relative Strength (CRS) score of 89.82. This means BTG is doing better than nearly 90% of all stocks in the market over the last year. Minervini notes that the largest winners almost always display high relative strength early in their advances, as it points to institutional buying and leadership.
Fundamental Momentum for Growth Investors
While the Trend Template makes sure a stock is technically healthy, the High Growth Momentum filter tries to find the fundamental "engine" pushing that price performance. For growth-oriented investors, BTG shows several strong data points that point to underlying business speed, a main part of Minervini's SEPA (Specific Entry Point Analysis) strategy.
- Large Quarterly Earnings Growth: The most notable numbers are in recent quarterly earnings per share (EPS) growth. The company's latest quarter showed a very large 600% year-over-year rise in EPS. The quarter before also reported a firm 100% growth. This sequence of sharp speed increase is just what growth investors and momentum methods like Minervini's look for, a fundamental reason that can draw major buying interest.
- Firm Sales Growth: This earnings jump is backed by solid top-line growth. Revenue for the last quarter climbed almost 75% compared to the same time last year, showing the earnings gain is pushed by operational performance, not only cost reductions or single events.
- Positive Analyst Changes for the Short Term: Looking forward, analyst guesses for the next quarter predict continued strong growth, with sales expected to increase over 151% and EPS forecast to grow by more than 2,100%. While long-term guesses have seen small downward changes, the steep upward path expected in the very near future can act as a strong short-term reason.
Present Technical Pattern and Risk Points
ChartMill's own technical report gives BTG a high score of 9 out of 10, noting its steady performance across both short and long-term periods. The report also points out a good setup pattern, with prices moving in a range between $4.31 and $4.86 after a firm earlier rise. This movement has happened with lower volatility, which can sometimes come before a new directional move.
The analysis finds a clear resistance area around $4.81. A clear move above this level could be seen as a possible entry signal for traders following the strategy, with a support area near $4.62 giving a sensible place for first stop-loss setting to handle risk. It is always key to recall that past performance and technical patterns do not assure future outcomes.
You can see the full, detailed technical analysis for BTG here: ChartMill Technical Report for BTG.
Conclusion
B2GOLD CORP presents a case where a strict, rules-based scanning process finds a security that fits with both momentum trading and growth investing ideas. Its chart meets the strict technical list of the Minervini Trend Template, confirming a part in a wider uptrend with better relative strength. Fundamentally, it shows the type of large quarterly earnings and sales growth that works as a reason for more price gains, meeting the needs for high growth momentum investors. As with any investment, this analysis is a beginning for more detailed review, not a final point.
Interested in finding other stocks that pass this combined scan for technical trend and high growth momentum? You can see the present scanning results here: High Growth Momentum + Trend Template Screen.
Disclaimer: This article is for informational and educational purposes only. It is not intended as investment advice, a recommendation, or an offer or solicitation to buy or sell any securities. The analysis is based on data provided and uses specific methods; past performance is not a guide to future results. Always do your own research and think about talking with a qualified financial advisor before making any investment decisions.