
Technical investors often use methodical processes to find possible trading chances, and one method joins technical condition evaluation with setup pattern identification. This approach analyzes stocks with two specialized measures: the Technical Rating, which gauges general technical condition over several periods, and the Setup Quality Rating, which finds congestion patterns that might come before notable price changes. Stocks with good scores on both measures frequently offer good risk-reward situations for breakout trading plans.
Technical Condition Evaluation
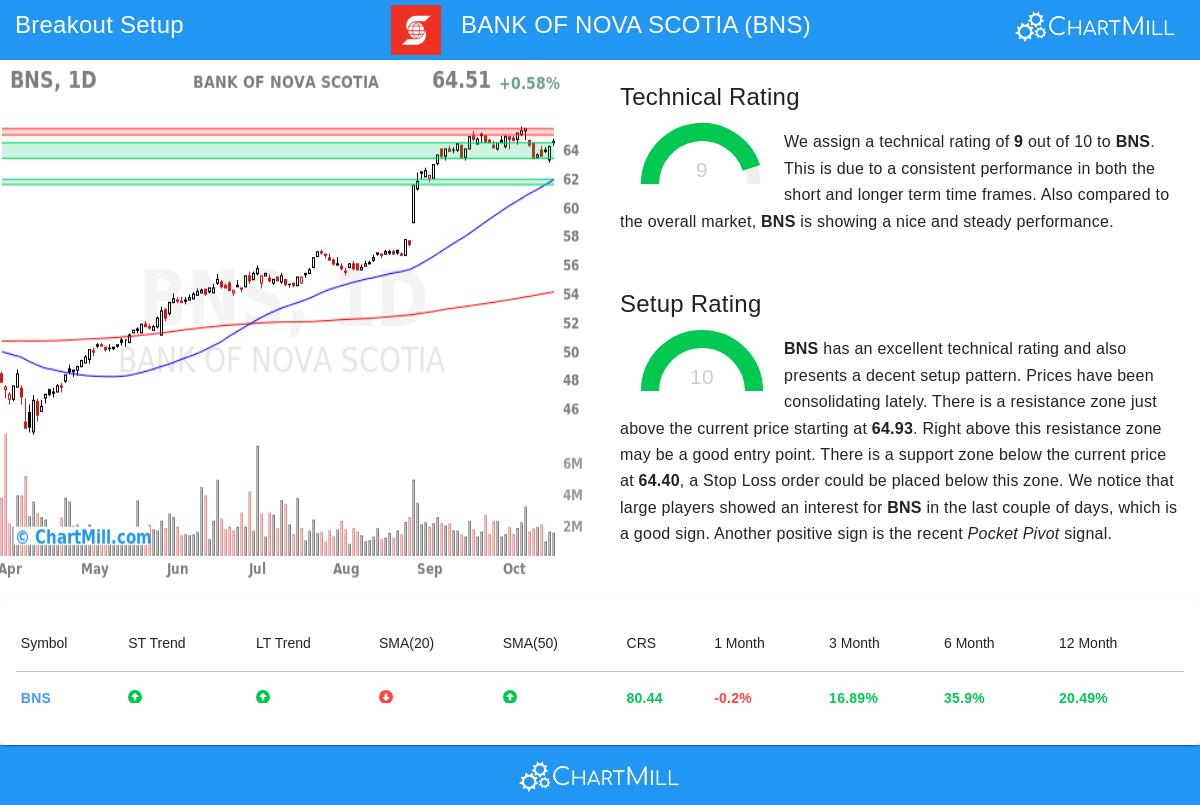
BANK OF NOVA SCOTIA (NYSE:BNS) shows very good technical features based on ChartMill's evaluation. The stock receives a Technical Rating of 9 out of 10, putting it in the market's best performers from a technical viewpoint. This good rating shows several encouraging elements that match the plan's need for stocks with a sound technical condition before thinking about entry timing.
Important technical positives contain:
- Both extended and brief period trends are good, showing continued upward movement
- The stock does better than 80% of all stocks in yearly performance reviews
- Inside the banking field, BNS does better than 88% of its 391 competitors
- Present trading close to 52-week highs points to continued condition
- Good volume features with average daily volume of 1.76 million shares provide sufficient market liquidity
The technical rating's value is in its capacity to screen for stocks with confirmed upward movement, lowering the chance of failed breakouts and raising the chance of continued moves after congestion phases.
Setup Pattern Evaluation
Besides its good technical base, BNS shows a very good setup pattern with a complete Setup Quality Rating of 10. This shows the stock has been exchanging in a narrow congestion band lately, making circumstances positive for possible breakout moves. The setup quality measure deals with the important question of timing by finding phases when stocks are gathering energy for their next notable move.
Present setup features contain:
- Prices have moved between $62.98 and $65.52 over the last month
- A clear resistance area is present between $64.93 and $65.37
- Several support points offer clear stop-loss placement chances
- Recent large trader activity found through volume study
- A pocket pivot signal seen, showing buying activity
The existence of these setup features implies BNS might be getting ready for a clear move above its present trading band, giving technical traders a specific risk-reward situation.
Trade Plan and Risk Control
The joining of good technicals and very good setup quality makes a structure for possible trading chances. Built on the technical study, a breakout above the resistance area could indicate the next stage upward, while the found support points give normal zones for risk control.
The full technical analysis report gives detailed views into support and resistance points, trend features, and extra elements that technical traders might find useful for their choice process. This amount of detailed study backs the plan's focus on complete assessment before position entry.
For investors looking for similar chances, the Technical Breakout Setups screen often finds stocks fitting these standards, giving a methodical process to finding possible breakout candidates across market situations.
Disclaimer: This analysis is for information only and does not make up investment guidance, suggestion, or request to buy or sell any securities. Trading carries large risk and might not be right for all investors. Always do your own study and think about talking with a qualified financial consultant before making investment choices.