
For investors using chart patterns and momentum, a methodical process for finding possible trades can be useful. One technique uses a filter for stocks that show both good technical condition and a distinct, usable price formation. The aim is to locate securities that are in clear upward trends but are now in a period of sideways movement, indicating a possible breakout could be near. This tactic uses two specific measures: a Technical Rating that judges the force and path of a stock's trend, and a Setup Quality Rating that examines the compactness and form of its recent price behavior. A strong result in both areas can indicate a notable chance for traders using technical analysis.
Technical Strength: A Good Base
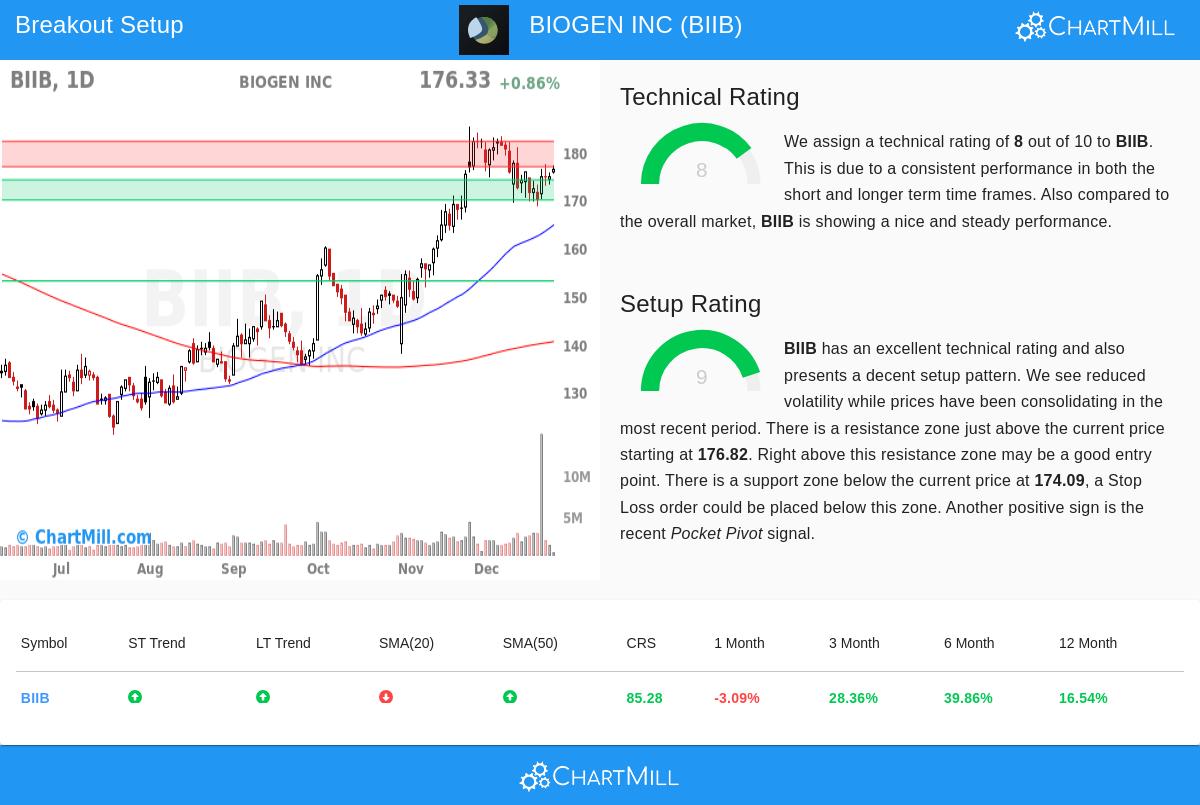
A high Technical Rating is important because it verifies the stock is not in a temporary rise but is part of a continued, sound uptrend. According to the newest ChartMill Technical Analysis report, BIOGEN INC (NASDAQ:BIIB) receives a solid rating of 8 out of 10. This number is supported by multiple main elements that show the stock's good momentum across different time periods.
- Trend Agreement: Both the longer-term and nearer-term trends for BIIB are marked as good. This agreement is a clear sign the stock's upward progress is backed by wider market factors and not only a brief surge.
- Moving Average Backing: The stock's price is above its important moving averages (50-day, 100-day, and 200-day), which are all arranged upward. This arrangement makes a sequence of possible floor levels below the present price.
- Relative Results: During the last year, BIIB has done better than 85% of all stocks. While part of this increase is linked to a recent large move, the year-to-date gain of more than 16% shows continued buyer activity.
This technical base is needed for the tactic, as it raises the chance that any breakout from a sideways pattern will keep going in the path of the main trend instead of reversing.
Setup Quality: The Formation for a Chance
While a firm trend is required, it is not enough for a good entry point. A stock can be overstretched and ready for a decline. This is where the Setup Quality Rating becomes key, as it finds times of sideways movement or "narrow" trading that frequently come before the next upward step. BIIB gets a very good 9 out of 10 on this measure, showing a superior formation is present.
The technical report notes several traits of this formation:
- Sideways Movement and Lower Volatility: Prices have been moving sideways in a set area between about $168.56 and $183.93 during the last month. This coiling behavior, happening after a firm rise, lets the stock reduce overbought status and gather force for its next move.
- Distinct Floor and Ceiling: The analysis points out a clear floor area between $169.90 and $174.09, made by a mix of trendlines and moving averages. Slightly above the current price sits a ceiling area from $176.82 to $182.10. These clear zones give specific points for trade planning.
- Supporting Volume Behavior: A recent "Pocket Pivot" signal was observed, which is a volume accumulation pattern where the price rises on volume greater than the highest down-volume day of the previous ten sessions. This can be an early signal of large buyer activity during a sideways phase.
For a breakout trader, this formation gives a clear plan: a possible entry point is seen just above the ceiling area (near $182.11), with a sensible stop-loss level set below the close floor area (near $169.89). This arrangement allows for a specific risk measure, which is a fundamental part of careful technical trading.
A Candidate for Watchlists
The mix of BIIB's firm technical rating and its superior setup formation makes it a stock that technical investors might want to observe carefully. It shows a situation where a basically sound trend is halting in a useful way, preparing for a possible continuation. The specified levels on the chart give a structure for arranging a trade if the stock gains the volume and momentum to move past the above resistance.
It is necessary to recall that no formation assures a win. The wider market condition, while presently good, can change, and company-specific news can always overcome technical formations. This examination simply finds a stock that has satisfied particular, measurable conditions often linked with winning breakout trades.
Find More Possible Breakout Formations
The filter that found BIIB operates each day, searching the market for other stocks that meet similar conditions of firm technicals and superior setups. You can review the present outcomes and perform your own examination using the Technical Breakout Setups screen.
Disclaimer: This article is for information only and does not form investment guidance, a suggestion, or an offer or request to buy or sell any securities. The examination shown is based on technical measures and should not be the only foundation for any investment choice. Always do your own investigation and think about your personal money situation and risk comfort before trading. Previous results do not show future outcomes.