
The CAN SLIM investment methodology, created by William O'Neil, uses fundamental and technical analysis to find high-growth stocks with solid momentum possibility. This structured method assesses companies using seven main factors represented by the letters CAN SLIM, concentrating on earnings growth, yearly profit patterns, new products or services, supply and demand forces, industry leadership, institutional investment, and the general market trend. People using this method look for companies displaying both good fundamental qualities and technical price firmness.
BEL FUSE INC-CL B (NASDAQ:BELFB) has become a candidate that deserves review using this strict structure. The New Jersey-based company designs, makes, and sells products that give power, provide safety, and link electronic circuits across three business areas: Power Solutions and Protection, Connectivity Solutions, and Magnetic Solutions.
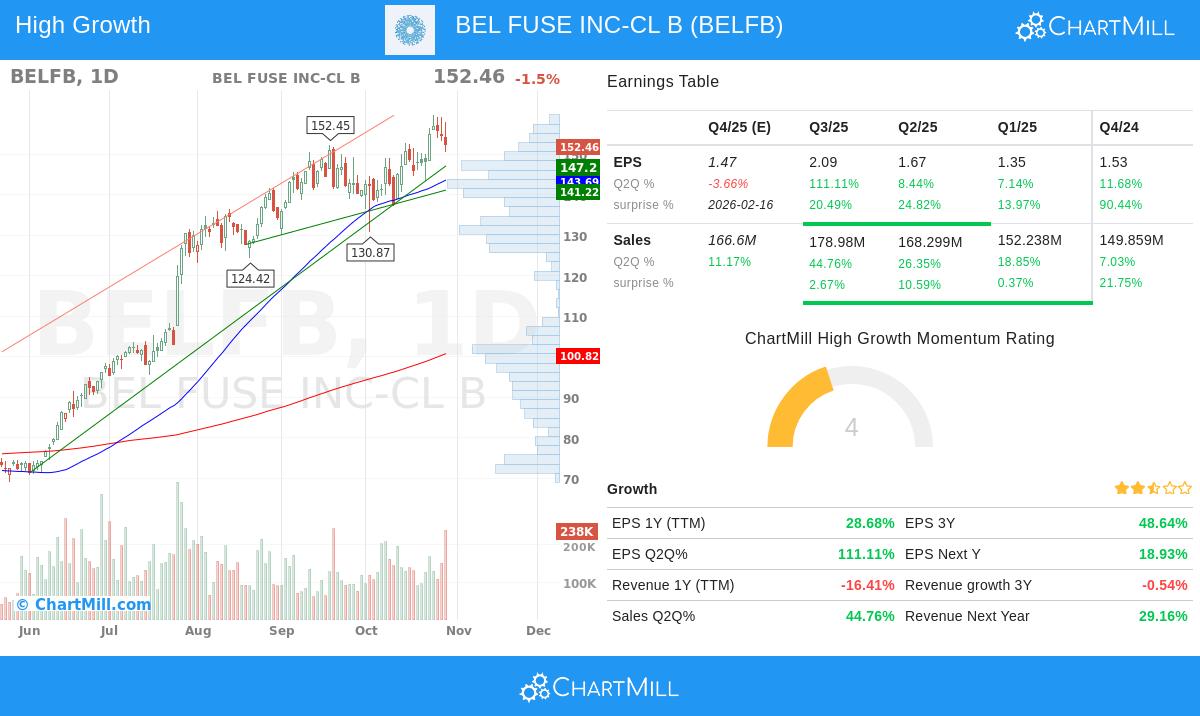
Earnings and Sales Momentum
The "C" in CAN SLIM highlights current quarterly earnings and sales growth, which BELFB displays convincingly. The company presents outstanding quarterly growth numbers that go beyond the system's usual limits:
- Quarterly EPS growth of 111.11% year-over-year
- Quarterly revenue growth of 44.76% year-over-year
These numbers are much higher than O'Neil's proposed minimum of 18-20% for earnings growth and 25% for sales growth, pointing to solid operational momentum. The increase in both earnings and sales implies the company is performing well in its market areas.
Annual Earnings Growth and Profitability
The "A" factor centers on maintained yearly earnings rises and profitability. BELFB's three-year EPS compound annual growth rate of 48.64% is much greater than the system's 25-50% goal span, showing steady long-term growth. The company's Return on Equity of 12.60% also satisfies the need for good profitability, doing better than 81% of industry competitors according to the fundamental analysis report. This pairing of fast growth and effective capital use fits with CAN SLIM's focus on companies that can increase earnings well over time.
Technical Strength and Market Leadership
The "N" and "L" parts stress the value of technical strength and market leadership. BELFB shows a very high relative strength of 93.07, meaning it performs better than 93% of all stocks in the market. This technical leadership is supported by the stock changing hands close to its 52-week high, a trait O'Neil specifically notes as positive. The technical analysis report gives BELFB a top score of 10/10, observing that both short-term and long-term patterns stay positive with various support levels formed below current prices.
Financial Health and Institutional Sponsorship
BELFB satisfies a few more CAN SLIM factors through responsible financial management:
- Debt-to-equity ratio of 0.63, much lower than the system's highest limit of 2
- Institutional ownership of 46.72%, inside the preferred span where institutions are involved but not excessively dominant
The reasonable debt amount offers financial room to maneuver, while the institutional sponsorship level indicates professional investors are acknowledging the company's possibility without having completely filled ownership. This equilibrium frequently generates continuing demand as more institutions find the opportunity.
Investment Considerations
Although BELFB shows solid agreement with CAN SLIM factors, investors should think about several points. The company's recent revenue decrease of 16.41% year-over-year differs from its good quarterly performance, but analysts forecast 14.69% yearly revenue growth going forward. Valuation numbers show a P/E ratio of 22.96, which seems fair compared to industry competitors but needs watching as growth forecasts change.
The wider market situation stays positive for CAN SLIM investing, with both short-term and long-term S&P 500 patterns good. This helpful setting lessens obstacles that could otherwise test growth stock performance.
For investors wanting to find other companies that satisfy CAN SLIM factors, this pre-configured screen supplies continuous screening outcomes based on the method discussed.
Disclaimer: This analysis is for informational purposes only and does not constitute investment advice, recommendation, or endorsement of any security. Investors should conduct their own research and consult with a qualified financial advisor before making investment decisions. Past performance is not indicative of future results.