
For technical investors, spotting stocks ready for a large price change usually involves two stages: first, locating a stock with good underlying technical condition, and second, waiting for it to develop a helpful price pattern that gives a defined, low-risk entry point. A systematic way to handle this is by using specialized ratings like the ChartMill Technical Rating and Setup Quality Score. The Technical Rating, a number from 0 to 10, measures the total strength of a stock's trend and momentum. The Setup Quality Score, also from 0 to 10, evaluates if the stock's present price action is settling into a possible base for a new move. Stocks that rate well on both measures, typically a Technical Rating of 7 or higher and a Setup Rating of 7 or higher, are marked as leading choices for technical breakout formations.
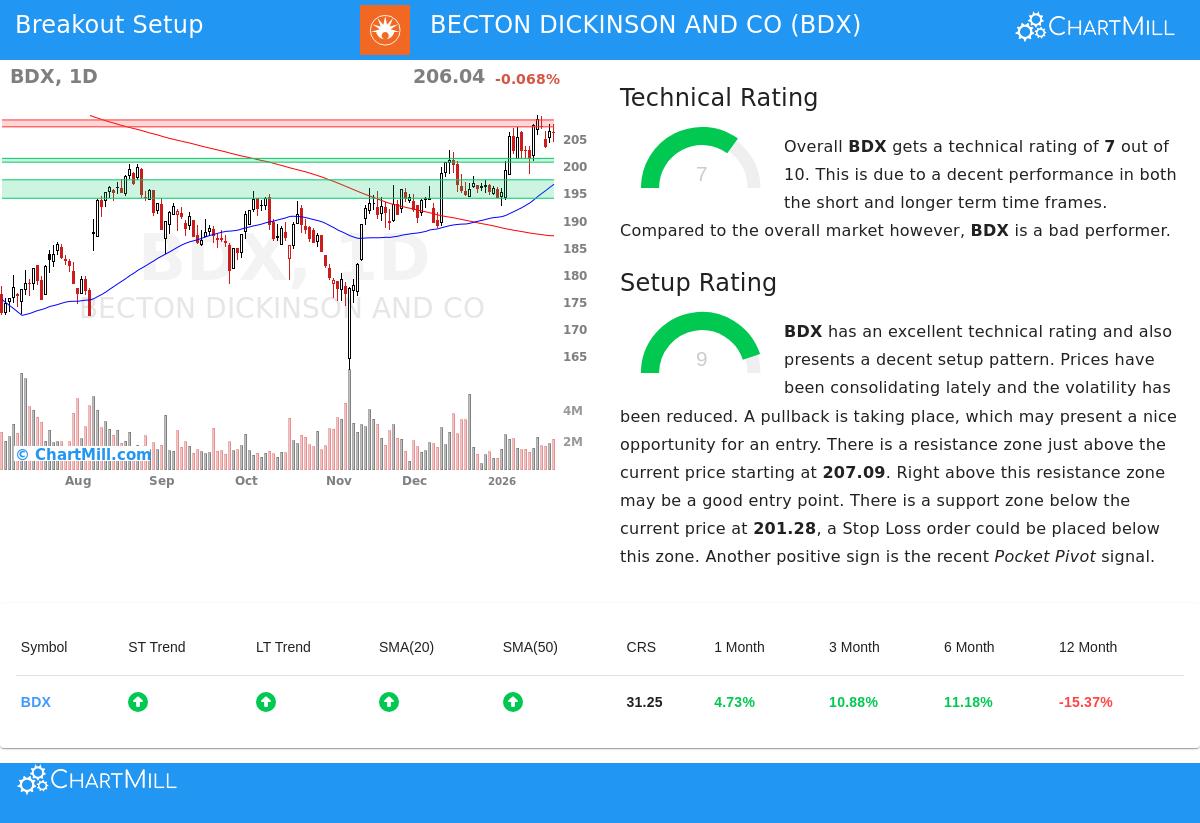
Becton, Dickinson and Co (NYSE:BDX), a worldwide head in medical technology, now shows a profile that fits this breakout screening method. Based on the most recent ChartMill Technical Analysis report, BDX receives a Technical Rating of 7 and a very high Setup Quality Rating of 9, putting it on the watchlist for investors searching for technically good stocks in a period of consolidation.
Technical Condition: A Good Base
The ChartMill Technical Rating of 7 for BDX shows the stock is in a verified uptrend. This score is important for the breakout plan because it selects for stocks that already have favorable momentum, raising the chance that a breakout will continue instead of quickly fading. The supporting data from the technical report backs this rating with several important positive signs:
- Trend Agreement: Both the near-term and longer-term trends for BDX are rated as positive, a very good basic signal for any technical formation.
- Moving Average Backing: The stock is priced above its important near- and medium-term moving averages (20-day, 50-day, and 100-day SMAs), which are all in upward arrangements. This framework often works as active support during declines.
- Recent Results: BDX has displayed positive results across recent periods, rising about 4.7% over the last month and almost 11% over the previous three and six months.
While the report states that BDX has trailed the wider S&P 500 over the last year, its recent trend gain and good relative standing within its group, it does better than 63% of its Health Care Equipment & Supplies industry members, add to its decent technical score.
Setup Quality: The Pause Before the Change
A high Technical Rating by itself is not a buy signal; a stock can be overbought and ready for a decline. This is where the outstanding Setup Quality Rating of 9 becomes important. This score finds times of price pause, where volatility lessens and the stock prepares for its next directional change. For BDX, the report points out a standard formation developing.
- Narrow Trading Band: Over the last month, BDX has been trading inside a set band between about $192.48 and $209.27. It is now trading close to the top of this band, indicating it is challenging a key resistance point.
- Defined Support and Resistance: The analysis notes a clear support area just under the present price, near $201.28, made by a mix of trendlines and moving averages. On the other hand, close overhead resistance is grouped between $207.09 and $208.36. This makes a clear plan for a possible trade: a breakout above resistance could indicate the next upward step, with the support area giving a reasonable place to set a protective stop-loss order.
- Favorable Volume Sign: Quite recently, the stock showed a "Pocket Pivot" sign, which is a price increase on larger-than-normal volume that hints at buying by large investors. This adds a note of confirmation to the helpful price action.
A Possible Technical Formation
From this analysis, a specific technical picture appears. The report proposes a possible entry point just above the noted resistance area, around $208.37, which would verify a breakout from the recent pause. A stop-loss order could then be set just under the nearby support area near $200.57, clearly setting the trade's risk. The space between these two points means a workable risk of about 3.7%, allowing for careful position sizing.
It is vital to recall that this is an example formation created from the technical factors. Individual investors must always modify entry, exit, and position size to match their own risk comfort and total plan.
Locating Additional Breakout Chances
BDX shows the kind of chance the Technical Breakout screen is made to find. For investors wanting to examine a new list of stocks that fit similar standards of good technical condition and high-quality setup patterns, new picks are found each day. You can view the present results by going to the Technical Breakout Setups screen.
Disclaimer: This article is for information only and is not investment advice, a suggestion, or an offer to buy or sell any security. The analysis uses technical data and automated scoring models, which have limits. Always do your own research, think about your money situation and risk comfort, and talk to a qualified financial advisor before making any investment choices. Past results do not guarantee future outcomes.