
For investors who use technical analysis to find possible trades, a common difficulty is locating stocks that are in a good upward trend and also ready for a move soon. A way to handle this is searching for stocks that have both a high technical condition score and a high pattern quality score. This method tries to find securities that are sound from a trend viewpoint and are also forming a pattern that indicates a breakout may be near. Becton, Dickinson and Co (NYSE:BDX) recently appeared in such a search, showing a profile that technical traders may find interesting.
Technical Condition: A Good Base
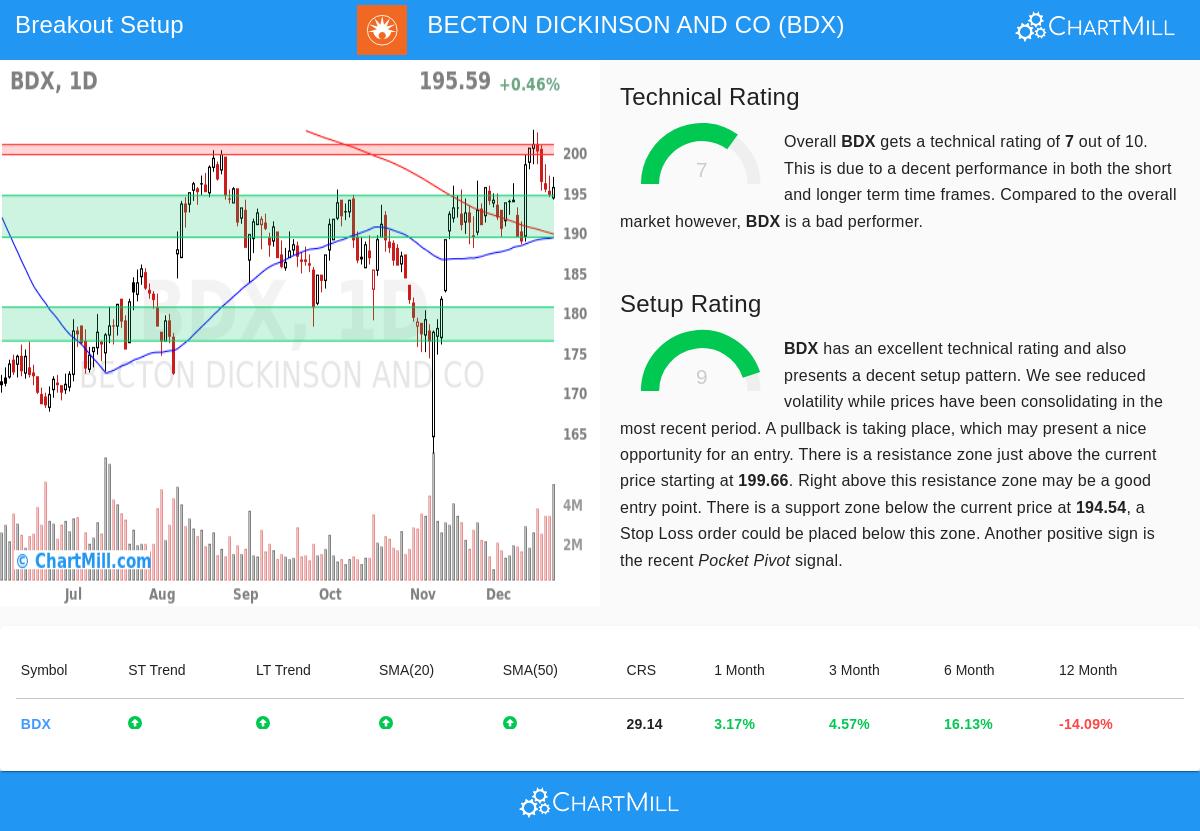
The first part of this strategy is judging the basic trend strength, which for BDX is measured by a ChartMill Technical Rating of 7 out of 10. This score looks at several time periods and momentum indicators to assess the stock's technical condition. A rating of 7 puts BDX clearly in an uptrend, an important step for this strategy as it aims to trade along with the main market momentum.
A more detailed view of the full technical report shows the specifics of this rating:
- Trend Direction: Both the recent and longer-term trends for BDX are now positive, a pairing that creates a good setting for more upward motion.
- Moving Average Position: The stock is priced above its important short- and medium-term moving averages (20-day and 50-day SMAs), which are also rising. This arrangement frequently acts as changing support.
- Performance Note: It is useful to see that while BDX's trend is positive, its performance next to the wider market is weaker. The stock is trading in the center of its 52-week range while the S&P 500 is near the top. This detail shows why the technical rating is key, it verifies the stock's own positive path even if it is not a top performer.
Pattern Quality: The Pause Before the Action
A good trend by itself is not a signal to buy, entering at a bad moment can cause quick losses. This is where the second part, the Pattern Quality Rating, becomes very important. BDX gets a high score of 9 out of 10 in this area. A high pattern score finds times of pause or "close" trading, where volatility lessens and the stock forms a base, often preparing for its next move in direction.
The present chart formation of BDX shows a high-quality pattern:
- Pause Range: In the last month, BDX has been trading between $188.52 and $202.75. It is now placed in the middle of this range, having moved down from the recent top. This winding action after a rise is a standard pre-breakout formation.
- Clear Support and Resistance: The study finds a definite support area between $189.32 and $194.54, made by a meeting of trendlines and moving averages. Just above the present price, a resistance area is between $199.66 and $200.90. These set levels give clear points for entry and managing risk.
- Positive Signs: A recent "Pocket Pivot" signal, a price increase on volume higher than normal, hints that buying may be happening inside this pause, adding a good detail to the pattern.
A Possible Breakout Situation
The pairing of a positive trend (Technical Rating 7) and a close pause (Pattern Rating 9) makes a clear trading idea. The technical report indicates a possible breakout pattern if BDX can gain the momentum to move past the above resistance.
- Entry: A move above the resistance area, specifically above $200.91, could be seen as a breakout, possibly starting the next rise.
- Risk Control: The nearby support area gives a sensible place to set a protective stop-loss order, for example below $189.31, to reduce loss if the breakout does not work.
- Market Setting: This pattern is happening while the S&P 500's recent trend is also positive, giving a good overall market setting for such a breakout try.
Locating Like Chances
BDX shows how mixing trend and pattern measures can find usable technical ideas. For investors wanting to search for other possible breakout choices, this method is used each day in the Technical Breakout Patterns screen.
You can see today's list of stocks that qualify and use the screen yourself here: Technical Breakout Patterns Screen.
Disclaimer: This article is for information only and is not investment advice, a suggestion, or an offer to buy or sell any security. The study is based on technical data and automatic scoring models. Investors should do their own research, think about their personal money situation, and talk with a qualified financial advisor before making any investment choices. Trading securities has risk, including the chance of losing the original amount invested.