
Identifying promising growth stocks often involves a dual approach: assessing both the underlying business momentum and the technical price trend. One method that systematically combines these elements is the strategy popularized by trader Mark Minervini. His approach filters for companies showing strong fundamental growth, such as accelerating earnings and sales, while also requiring the stock to be in a confirmed, strong uptrend as defined by his "Trend Template." This framework helps investors focus on market leaders with the possibility for major price gains, avoiding weaker stocks that may show growth but lack positive price momentum.
California Bancorp (NASDAQ:BCAL), a commercial banking services provider in Northern and Southern California, recently appeared through a screening process made to find stocks that fit this high-growth, momentum-oriented philosophy. The screen used Minervini's strict Trend Template to confirm technical strength and combined it with a "High Growth Momentum" rating to filter for solid fundamental expansion.
Assessing the Trend Template Alignment
A core belief of the Minervini strategy is to invest in the direction of the existing trend, buying strength rather than trying to catch a falling knife. The Trend Template provides a specific checklist to identify stocks in a Stage 2 advance, marked by rising moving averages and closeness to new highs.
A review of California Bancorp's chart and key metrics shows a notable fit with these technical criteria:
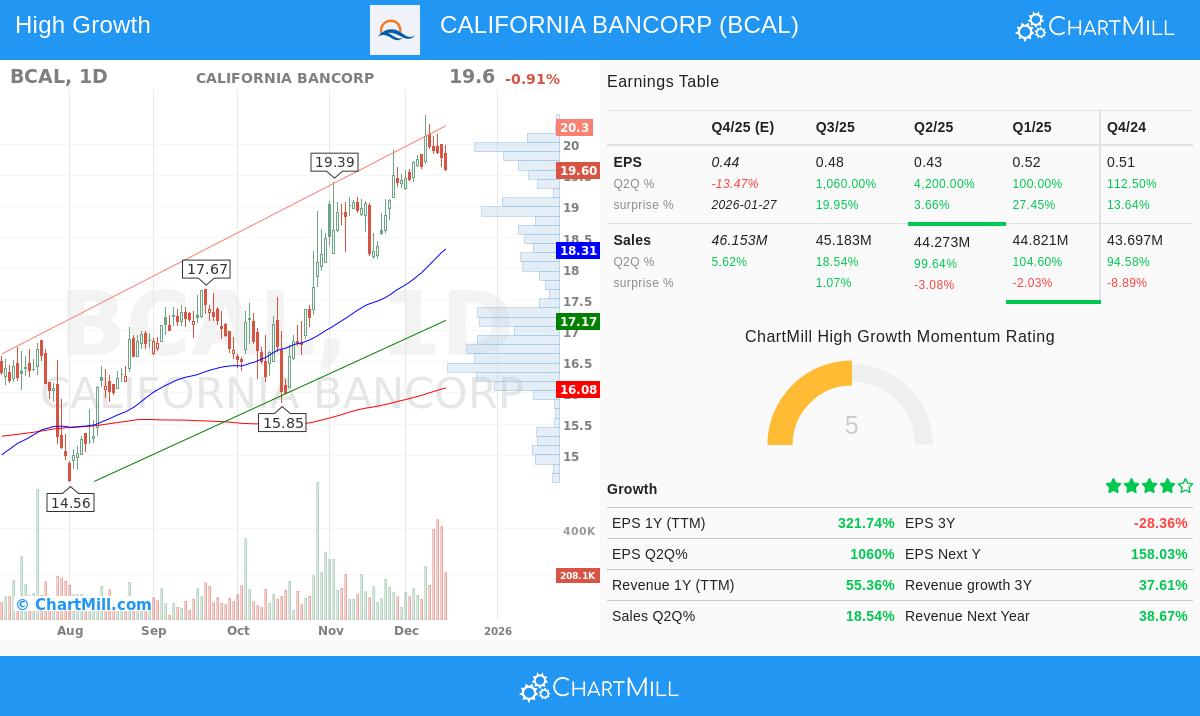
- Price Above Key Moving Averages: The stock's last price of $19.60 trades well above its rising 50-day ($18.31), 150-day ($16.73), and 200-day ($16.08) simple moving averages (SMAs). This stacked order shows sustained buying pressure across short, medium, and long-term timeframes.
- Moving Average Order: The 50-day SMA is above both the 150-day and 200-day SMAs, while the 150-day SMA is above the 200-day SMA. This sequential positive order is a key feature of the Trend Template, confirming a well-set uptrend.
- Closeness to Highs: At $19.60, BCAL is trading within 4.3% of its 52-week high of $20.47 and stands about 65% above its 52-week low of $11.87. Minervini notes that true market leaders often make their largest moves while trading near new highs, not while they are "cheap" and staying near lows.
- Strong Relative Strength: With a ChartMill Relative Strength (CRS) score of 78.71, the stock beats nearly 79% of the broader market. High relative strength is important, as it shows the stock is being bought and is a leader, not a follower, in the current market.
This technical view suggests BCAL is in a clear, sustained uptrend, meeting the basic needs for further study under a momentum-based strategy.
Evaluating High-Growth Fundamentals
While a strong chart is necessary, the Minervini method looks for the fuel that pushes such performance: outstanding business growth. The strategy searches for accelerating earnings, expanding profit margins, and positive analyst revisions, factors that often draw institutional investment and can push a stock higher.
California Bancorp's recent financial results show several high-growth traits that likely led to its screening selection:
- Major Earnings Growth: The company has reported very large year-over-year earnings per share (EPS) growth in recent quarters. The most recent quarter saw EPS jump 1060% compared to the same period last year, after a 4200% increase in the prior quarter. While these percentages are enlarged from a small base, the trend of large acceleration is clear.
- Consistent Earnings Surprises: BCAL has exceeded analyst EPS estimates in each of the last four quarters, with an average beat of over 16%. This steady outperformance can build trust with investors and lead to higher revisions in future estimates.
- Getting Better Profitability: The company's profit margin in the last reported quarter was 27.4%, showing an improvement from the 25.3% margin in the prior quarter. Rising margins show operational efficiency and pricing power, key features of a high-quality growth business.
- Strong Revenue Growth: Top-line growth is also solid, with trailing twelve-month revenue up over 55%. Recent quarterly sales growth numbers have been steadily strong, including an 18.5% increase in the last quarter.
- Positive Analyst View: Showing optimism about the company's future, analysts have raised their average earnings estimate for the next fiscal year by nearly 7% over the past three months.
This mix of major earnings momentum, consistent beats, and getting better fundamentals provides a clear catalyst for the stock's strong technical performance, fitting the "growth driving price" model that growth and momentum investors look for.
Technical Health and Setup Summary
Beyond the specific Trend Template criteria, a wider look at the stock's technical health is positive. ChartMill's own Technical Rating for BCAL is a solid 8 out of 10, confirming both its long-term and short-term trends are good. The analysis notes the stock is currently showing a bull flag pattern, a pause or small pullback within an uptrend that can sometimes come before the next move higher. Volume has also been higher in recent days, which can show institutional buying during the rise.
For a detailed breakdown of support and resistance levels, and the automated trading setup from this analysis, you can review the full ChartMill Technical Report for BCAL.
Finding Similar Opportunities
California Bancorp presents a case study in how the combination of strict technical trend-following and strict fundamental growth screening can find potential investment candidates. For investors interested in using this dual-focus approach to discover other opportunities, the predefined screen that highlighted BCAL is available to run. You can find more potential candidates by using this "High Growth Momentum + Trend Template" screen on ChartMill.
Disclaimer: This article is for informational and educational purposes only. It is not a recommendation to buy or sell any security. The analysis is based on data provided and screening methodologies described, which have inherent limitations. Always conduct your own thorough research, consider your individual financial situation and risk tolerance, and consult with a qualified financial advisor before making any investment decisions. Past performance is not indicative of future results.