
Our stock screener has singled out BOOZ ALLEN HAMILTON HOLDINGS (NYSE:BAH) as an attractive growth opportunity. BAH is demonstrating remarkable growth potential while maintaining strong financial indicators, making it a reasonably priced option. We'll explore this further.
Unpacking BAH's Growth Rating
ChartMill employs its own Growth Rating system for all stocks. This score, ranging from 0 to 10, is derived by evaluating different growth factors, such as EPS and revenue growth, taking into account both past performance and future projections. BAH has earned a 7 for growth:
- The Earnings Per Share has grown by an nice 17.18% over the past year.
- Measured over the past years, BAH shows a quite strong growth in Earnings Per Share. The EPS has been growing by 14.79% on average per year.
- Looking at the last year, BAH shows a very strong growth in Revenue. The Revenue has grown by 42.57%.
- Measured over the past years, BAH shows a quite strong growth in Revenue. The Revenue has been growing by 9.72% on average per year.
- Based on estimates for the next years, BAH will show a quite strong growth in Earnings Per Share. The EPS will grow by 13.38% on average per year.
- BAH is expected to show quite a strong growth in Revenue. In the coming years, the Revenue will grow by 9.52% yearly.
ChartMill's Evaluation of Valuation
ChartMill employs its own Valuation Rating system for all stocks. This score, ranging from 0 to 10, is determined by evaluating different valuation factors, including price to earnings and free cash flow, both in absolute terms and relative to the market and industry. BAH has earned a 5 for valuation:
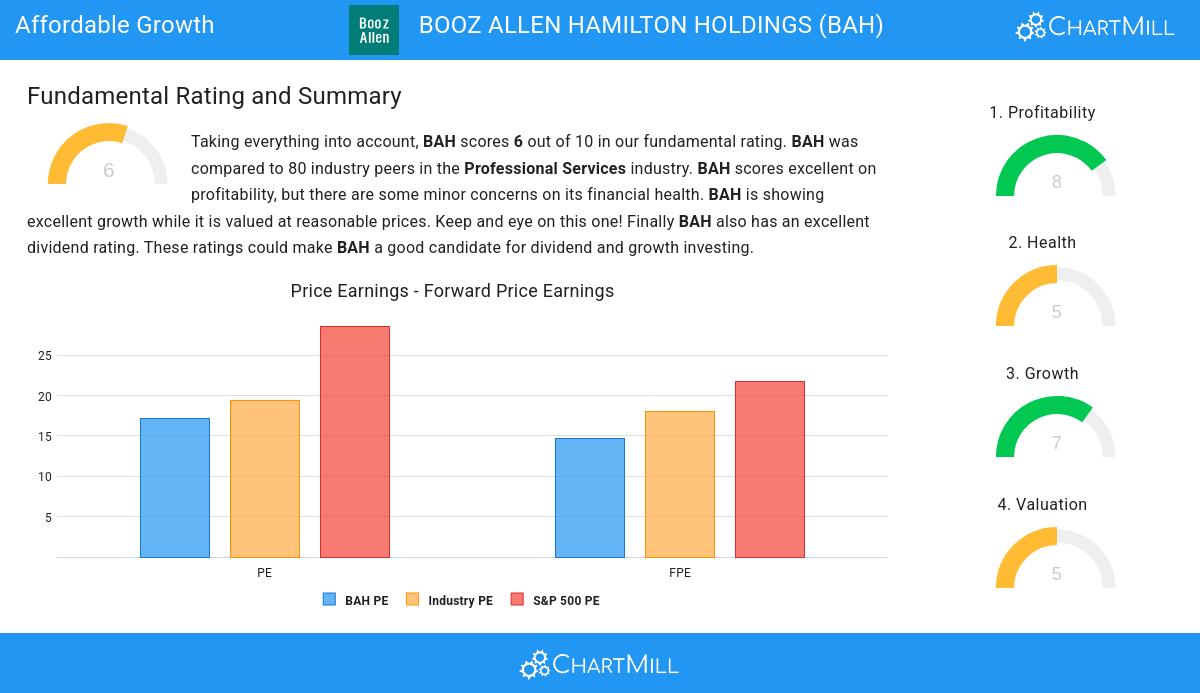
- The average S&P500 Price/Earnings ratio is at 28.62. BAH is valued slightly cheaper when compared to this.
- Based on the Price/Forward Earnings ratio, BAH is valued a bit cheaper than the industry average as 67.50% of the companies are valued more expensively.
- BAH is valuated rather cheaply when we compare the Price/Forward Earnings ratio to 21.72, which is the current average of the S&P500 Index.
- Based on the Enterprise Value to EBITDA ratio, BAH is valued a bit cheaper than the industry average as 78.75% of the companies are valued more expensively.
- Based on the Price/Free Cash Flow ratio, BAH is valued a bit cheaper than the industry average as 76.25% of the companies are valued more expensively.
- BAH has an outstanding profitability rating, which may justify a higher PE ratio.
- BAH's earnings are expected to grow with 13.07% in the coming years. This may justify a more expensive valuation.
Health Examination for BAH
Every stock is evaluated by ChartMill, receiving a Health Rating on a scale of 0 to 10. This assessment considers different health aspects, including liquidity and solvency, both in absolute terms and relative to industry peers. BAH has achieved a 5 out of 10:
- BAH has an Altman-Z score of 5.14. This indicates that BAH is financially healthy and has little risk of bankruptcy at the moment.
- BAH has a Altman-Z score of 5.14. This is amongst the best in the industry. BAH outperforms 86.25% of its industry peers.
- The Debt to FCF ratio of BAH is 4.00, which is a good value as it means it would take BAH, 4.00 years of fcf income to pay off all of its debts.
Assessing Profitability for BAH
ChartMill assigns a proprietary Profitability Rating to each stock. The score is computed by evaluating various profitability ratios and margins and ranges from 0 to 10. BAH was assigned a score of 8 for profitability:
- BAH has a Return On Assets of 15.10%. This is amongst the best in the industry. BAH outperforms 90.00% of its industry peers.
- BAH has a Return On Equity of 85.10%. This is amongst the best in the industry. BAH outperforms 93.75% of its industry peers.
- BAH has a Return On Invested Capital of 23.56%. This is amongst the best in the industry. BAH outperforms 88.75% of its industry peers.
- The last Return On Invested Capital (23.56%) for BAH is above the 3 year average (13.75%), which is a sign of increasing profitability.
- With a decent Profit Margin value of 7.00%, BAH is doing good in the industry, outperforming 72.50% of the companies in the same industry.
- BAH has a Operating Margin of 11.08%. This is in the better half of the industry: BAH outperforms 78.75% of its industry peers.
- BAH's Operating Margin has improved in the last couple of years.
- Looking at the Gross Margin, with a value of 54.71%, BAH is in the better half of the industry, outperforming 63.75% of the companies in the same industry.
Every day, new Affordable Growth stocks can be found on ChartMill in our Affordable Growth screener.
For an up to date full fundamental analysis you can check the fundamental report of BAH
Disclaimer
This is not investing advice! The article highlights some of the observations at the time of writing, but you should always make your own analysis and invest based on your own insights.