
For investors who use charts and price action to guide their choices, a methodical way to find possible trades is important. One technique looks for stocks that have good technical measures and are making a useful price pattern, a pairing that can point to a likely breakout chance. This plan centers on two main proprietary measures from ChartMill: the Technical Rating, which judges the general condition and direction of a stock, and the Setup Quality Rating, which checks if the stock is resting in a manner that gives a distinct, lower-risk entry point. The aim is to find leading stocks that are halting before their next possible move up.
A recent search using this method has pointed out AstraZeneca PLC-SPONS ADR (NASDAQ:AZN) as a notable candidate. The British-Swedish pharmaceutical company, with a wide range of products in oncology, cardiovascular, and respiratory medicines, is not only showing fundamental business health but is also drawing a strong picture on the charts.
A Base of Technical Health
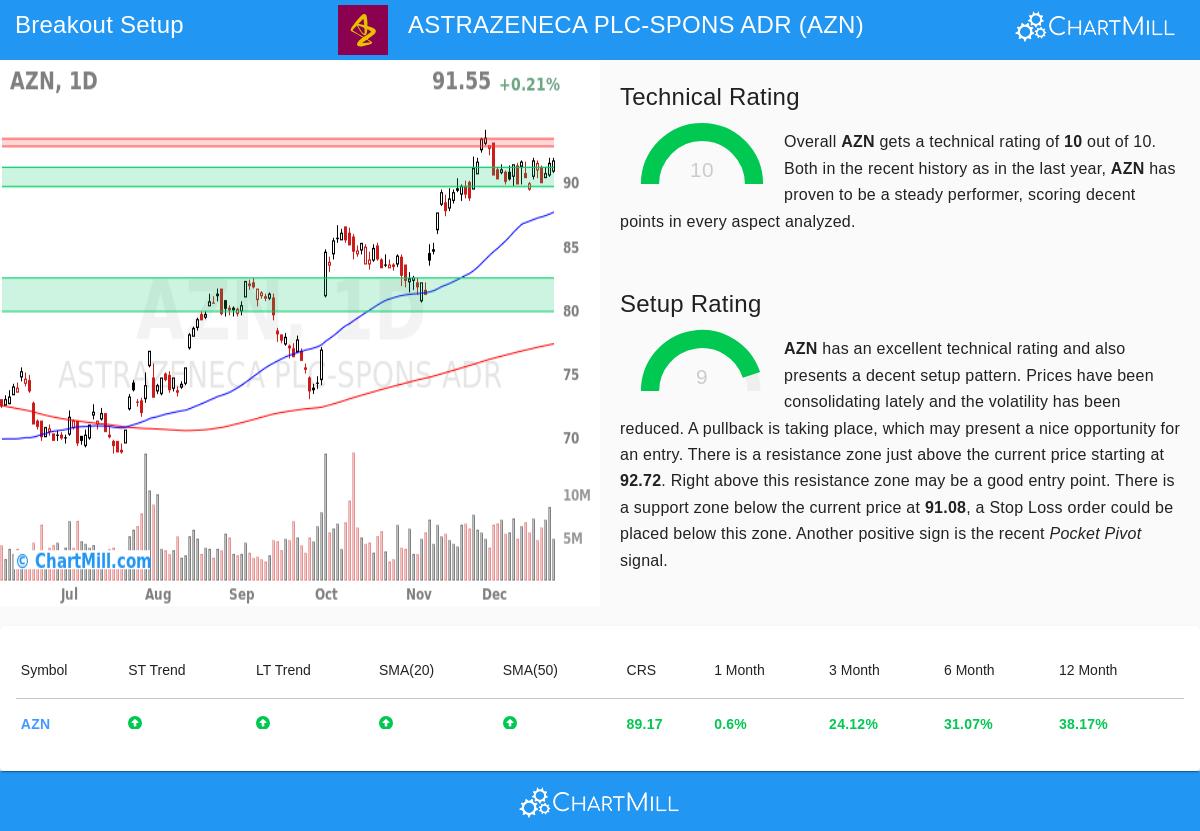
The main filter in a breakout search is a high Technical Rating, as it confirms the stock is in a steady uptrend and doing better than the wider market. AstraZeneca does very well here, getting a top score of 10. A close look at the ChartMill Technical Analysis report for AZN shows the supports of this solid rating:
- Trend Agreement: Both the long-term and short-term trends for AZN are marked as positive. This agreement across different periods is a typical sign of a healthy, trending stock.
- Strong Relative Performance: The stock has done better than 89% of all other stocks over the last year, affirming its place as a market leader instead of just gaining from a general market rise.
- Price Level: AZN is trading close to its 52-week high, which frequently shows continued buying interest and an absence of supply from investors waiting to sell at a break-even price.
- Moving Average Support: The stock's price is above all important moving averages (20, 50, 100, and 200-day), and each of these averages is itself moving upward. This forms a tiered support base below the price.
This outstanding technical rating answers the first important question for a trader: "Is this a stock I want to own?" The information suggests a clear yes, as AZN is in a strong, continuing uptrend.
A Good Setup for a Possible Entry
A solid trend by itself is not a buy signal; buying a stock that is "overstretched" can result in quick declines. This is where the Setup Quality Rating becomes key, answering the trader's second question: "Is now a good time to buy?" AstraZeneca gets a 9 here, meaning it is making a clear consolidation pattern.
The technical report states that prices have been moving in a narrow band over the last month, between about $89.28 and $94.02. This decrease in movement, after a good earlier rise, is often called a "bull flag" pattern. Such patterns show a pause where the stock absorbs its gains, possibly preparing for a resumption of the earlier uptrend.
Important parts of the setup include:
- A set resistance area just above the present price, around $92.72 to $93.32.
- A nearby support area below, from $89.56 to $91.08, which could act as a reasonable place for a protective stop-loss order.
- A recent "Pocket Pivot" signal, which is a volume-based sign pointing to accumulation by large investors during the consolidation.
This pairing, a narrow band near highs, clear support and resistance levels, and large investor buying interest, makes a situation where a breakout above resistance could be a technically reasonable entry signal.
Combining the Breakout Idea
For a technical investor, the attraction of AstraZeneca is in the meeting of these two high scores. The top Technical Rating (10) confirms the stock is a leader in a solid uptrend, which is the necessary background for any breakout trade. The high Setup Quality Rating (9) means the stock is not overbought but is instead tightening within a set band, giving a clear plan for entry and risk control.
The automated study suggests a possible trade setup with an entry just above the resistance area at $93.33 and a stop-loss below the support area at $89.55. It is very important to note that this is a mechanical example based only on price levels; each trader must change such details to match their own risk comfort and verify the breakout with price and volume behavior.
Locating Comparable Chances
The breakout setup seen in AstraZeneca is not a single event. This search method is used each day to the market to find stocks showing comparable mixes of technical health and useful patterns. Investors searching for new ideas can review the present list of matching stocks by going to the Technical Breakout Setups screen.
Disclaimer: This article is for information only and does not make up investment advice, a suggestion, or an offer or request to buy or sell any securities. The study is based on technical information and automated scoring models. All investing and trading includes risk, including the possible loss of principal. Readers should do their own study and talk with a qualified financial expert before making any investment choices. Past results do not guarantee future outcomes.