
Exploring Growth Potential: AXON ENTERPRISE INC (NASDAQ:AXON) and Its Base Formation. Growth investors seek promising revenue and EPS growth, and AXON ENTERPRISE INC has come under our scrutiny for potential growth investing. While it's crucial to do your own research, we've detected AXON ENTERPRISE INC on our screen for growth with base formation, suggesting it merits a closer look.
A Closer Look at Growth for AXON
ChartMill assigns a proprietary Growth Rating to each stock. The score is computed by evaluating various growth aspects, like EPS and revenue growth. We take into account the history as well as the estimated future numbers. AXON was assigned a score of 8 for growth:
- AXON shows a strong growth in Earnings Per Share. In the last year, the EPS has been growing by 42.37%, which is quite impressive.
- AXON shows a strong growth in Earnings Per Share. Measured over the last years, the EPS has been growing by 41.41% yearly.
- The Revenue has grown by 62.68% in the past year. This is a very strong growth!
- Measured over the past years, AXON shows a very strong growth in Revenue. The Revenue has been growing by 31.44% on average per year.
- Based on estimates for the next years, AXON will show a quite strong growth in Earnings Per Share. The EPS will grow by 16.58% on average per year.
- AXON is expected to show quite a strong growth in Revenue. In the coming years, the Revenue will grow by 19.50% yearly.
Health Examination for AXON
To gauge a stock's financial health, ChartMill utilizes a Health Rating on a scale of 0 to 10. This comprehensive evaluation encompasses liquidity and solvency, both in absolute terms and in comparison to industry peers. AXON has earned a 7 out of 10:
- An Altman-Z score of 13.02 indicates that AXON is not in any danger for bankruptcy at the moment.
- AXON has a Altman-Z score of 13.02. This is amongst the best in the industry. AXON outperforms 96.92% of its industry peers.
- AXON has a debt to FCF ratio of 2.06. This is a good value and a sign of high solvency as AXON would need 2.06 years to pay back of all of its debts.
- The Debt to FCF ratio of AXON (2.06) is better than 92.31% of its industry peers.
- A Debt/Equity ratio of 0.29 indicates that AXON is not too dependend on debt financing.
- AXON's Debt to Equity ratio of 0.29 is fine compared to the rest of the industry. AXON outperforms 70.77% of its industry peers.
- AXON has a Current Ratio of 2.30. This indicates that AXON is financially healthy and has no problem in meeting its short term obligations.
- AXON has a Quick Ratio of 2.04. This indicates that AXON is financially healthy and has no problem in meeting its short term obligations.
- With a decent Quick ratio value of 2.04, AXON is doing good in the industry, outperforming 76.92% of the companies in the same industry.
Profitability Examination for AXON
ChartMill's Profitability Rating offers a unique perspective on stock analysis, providing scores from 0 to 10. These ratings consider a wide range of profitability metrics and margins, both in comparison to industry peers and on their own merits. For AXON, the assigned 6 is a significant indicator of profitability:
- AXON's Return On Assets of 11.40% is amongst the best of the industry. AXON outperforms 93.85% of its industry peers.
- The Return On Equity of AXON (21.92%) is better than 89.23% of its industry peers.
- AXON has a better Profit Margin (20.06%) than 95.38% of its industry peers.
- In the last couple of years the Profit Margin of AXON has grown nicely.
- AXON's Gross Margin of 59.04% is amongst the best of the industry. AXON outperforms 90.77% of its industry peers.
How do we evaluate the setup for AXON?
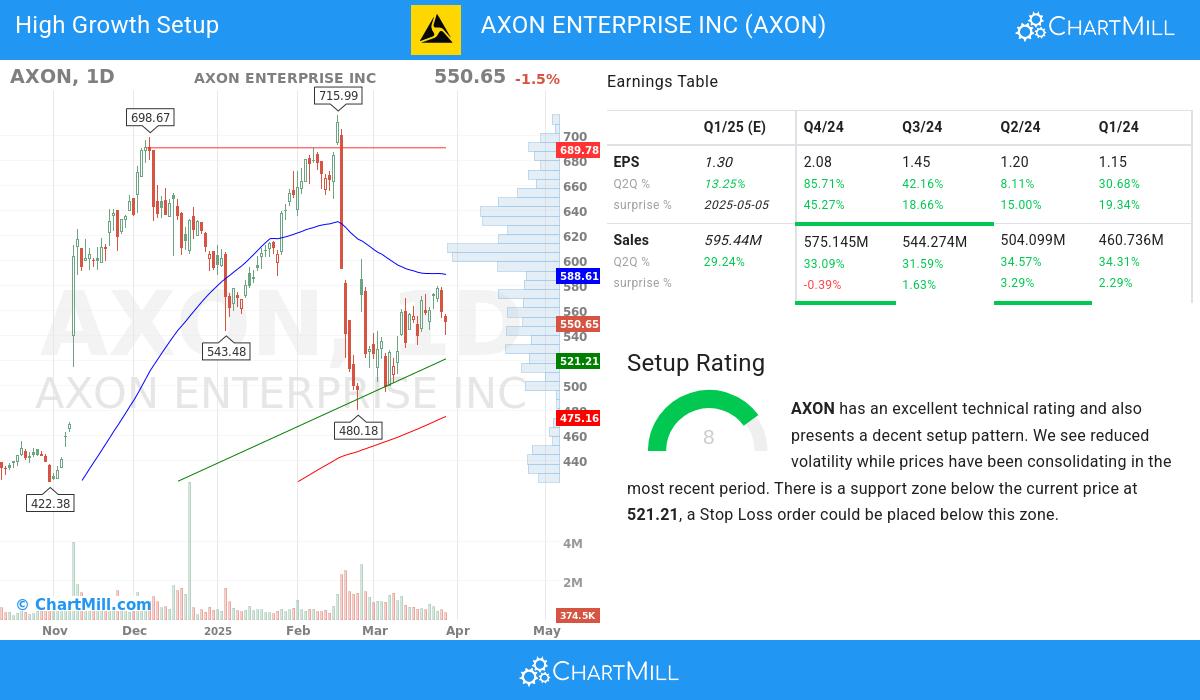
ChartMill assigns a Setup Rating to evaluate the consolidation level of a stock. This rating, ranging from 0 to 10, is updated daily and considers various short-term technical indicators. The current setup rating for AXON is 8:
Besides having an excellent technical rating, AXON also presents a decent setup pattern. We see reduced volatility while prices have been consolidating in the most recent period. There is a support zone below the current price at 521.21, a Stop Loss order could be placed below this zone.
Our Strong Growth screener lists more Strong Growth stocks and is updated daily.
Check the latest full fundamental report of AXON for a complete fundamental analysis.
Check the latest full technical report of AXON for a complete technical analysis.
Disclaimer
This is not investing advice! The article highlights some of the observations at the time of writing, but you should always make your own analysis and invest based on your own insights.