
For investors looking to join strong growth possibility with organized trend methods, the system created by Mark Minervini offers a notable structure. This method, called the Specific Entry Point Analysis (SEPA) plan, methodically finds leading stocks by applying strict technical and fundamental measures. On the technical part, the base is the Minervini Trend Template, a group of rules made to select for stocks in solid, confirmed upward trends. Fundamentally, the plan centers on companies showing firm and quickening earnings and sales expansion, positive earnings surprises, and rising analyst changes, the signs of real high-growth momentum. By checking for stocks that meet both the Trend Template and a high Growth Momentum score, investors try to find companies that are not only technically good but also fundamentally set for more success.
One example coming from this two-part check is AXOGEN INC (NASDAQ:AXGN). The medical device company, which focuses on surgical answers for peripheral nerve repair, seems to match closely with the mechanical order of the Minervini plan.
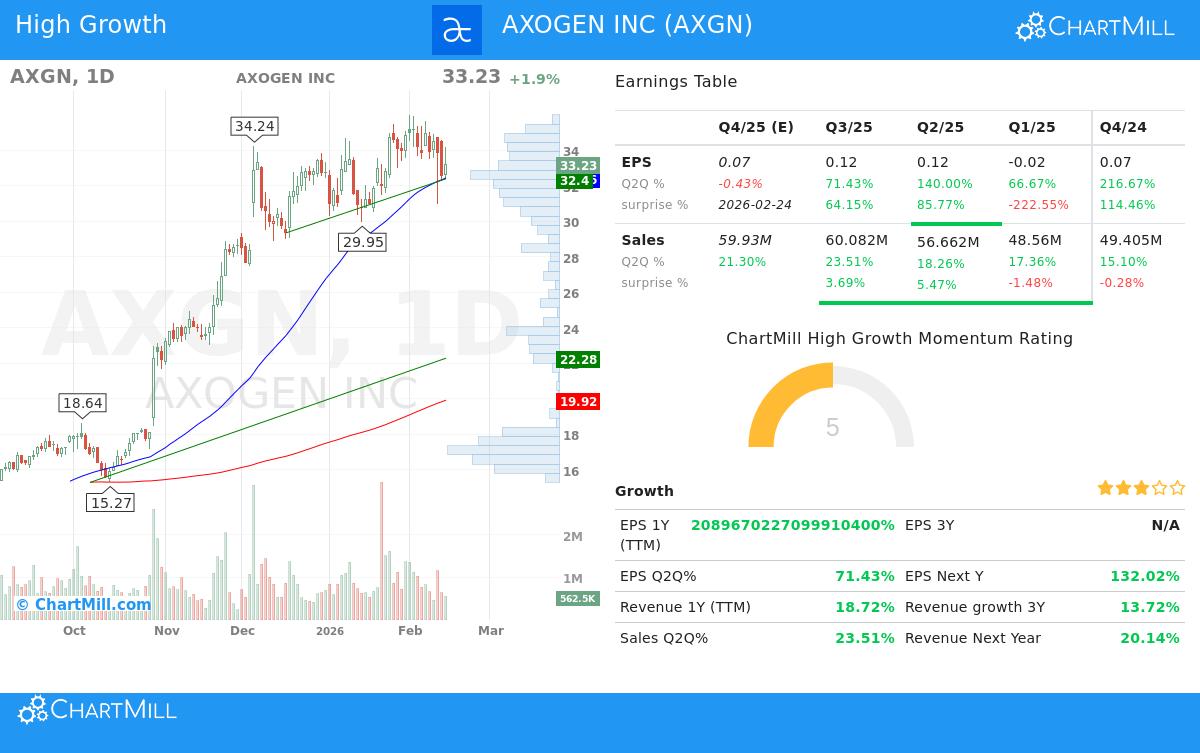
Meeting the Minervini Trend Template
The Trend Template’s main job is to make sure an investor is only looking at stocks where the trend is clearly positive and institutional buying is present. A look at AXGN’s chart and important numbers shows it meets the vital points:
- Price Above Key Moving Averages: The stock’s last price of $33.23 trades well above its rising 50-day ($32.46), 150-day ($22.69), and 200-day ($19.92) simple moving averages (SMAs). This order is a basic rule, confirming the stock is in a set long-term bull market stage (Stage 2).
- Moving Average Order: The 50-day SMA sits above both the 150-day and 200-day SMAs, while the 150-day SMA is above the 200-day SMA. This layered, upward-sloping order shows quickening momentum across several timeframes, a main idea of the template.
- Nearness to Highs: A stock trading close to its 52-week high often shows leadership and firm momentum. At $33.23, AXGN is trading within 8% of its 52-week high of $36.00, well within the template’s need of being within 25% of the high. At the same time, the stock is about 260% above its 52-week low of $9.22, much more than the 30% limit and showing a solid recovery trend.
- Better Relative Strength: Maybe most revealing is AXGN’s ChartMill Relative Strength (CRS) score of 94.27. This means the stock’s price action over the past year beats about 94% of the whole market. Within its Health Care Equipment & Supplies industry, it beats 96% of similar companies. Minervini regularly notes that real market leaders show high relative strength, as it shows continued institutional demand.
Qualifying as a High-Growth Candidate
The technical strength is supported by fundamental numbers that show firm and quickening business results, which is the "fuel" for a maintained uptrend following the SEPA method.
- Strong Earnings Growth: AXGN shows the type of earnings quickening the plan looks for. While the trailing twelve-month (TTM) growth number is unusually high, the more related quarterly and yearly numbers are notable. The company’s last reported quarter showed year-over-year EPS growth of 71.4%, after an even stronger 140% growth in the quarter before. For the last reported full fiscal year, EPS grew by 172%.
- Steady Revenue Growth: Top-line growth gives trust to earnings gains. AXGN’s revenue growth has been stable and quickening, with the last quarter showing 23.5% year-over-year growth. Yearly revenue growth has increased from 8.8% three years ago to 17.8% in the most recent TTM period.
- Positive Earnings Surprises and Changes: The company has topped analyst EPS estimates in three of the last four quarters by an average of over 10%. Also, analysts have been lifting their estimates, with the average EPS guess for the next fiscal year moved up by 0.58% over the last three months. These upward changes are a vital catalyst, often coming before more institutional buying.
- Getting Better Profitability: After times of losses, the company has lately become profitable, with a positive profit margin in the last several quarters. This move toward maintained profitability is a big fundamental change for a growth company.
Technical Health and Setup Summary
The given technical study report gives a number-based look at AXGN’s chart health. The stock gets a high ChartMill Technical Rating of 9 out of 10, showing its very good long-term positive trend and better relative performance. The long-term trend is scored as positive, while the short-term trend is neutral, hinting at a time of consolidation inside the larger uptrend, a common trait before a possible next move up.
This consolidation is seen in a Setup Quality Rating of 6. The report notes prices have been trading in a range between about $30.52 and $36.00 recently, with the current price near the middle. A set resistance zone is found between $34.94 and $35.22. From a Minervini view, this could be seen as a possible volatility contraction pattern (VCP), where a clear move above this resistance on high volume could give a specific, lower-risk entry point for trend-followers. The full technical report, which lists support and resistance levels, can be seen here.
Conclusion
AXOGEN INC shows an example of matching with an orderly growth and momentum plan. It meets the strict Minervini Trend Template, confirming it is in a solid, institution-led uptrend. Fundamentally, it shows the high-growth signs, quickening earnings and sales, positive surprises, and upward changes, that give the fundamental reason for that trend to continue. While past results are not a promise, the combination of these technical and fundamental points makes AXGN a stock deserving of more study for investors using such a method.
For investors wanting to find other stocks that currently fit this mix of high-growth momentum and firm technical trends, the checking measures used can be looked at more. You can find more possible examples by seeing the "High Growth Momentum + Trend Template" check here.
Disclaimer: This article is for information and learning only. It is not meant as investment advice, a suggestion, or an offer to buy or sell any security. The study is based on data and a specific investment method, but all investments have risk, including the possible loss of money. You should do your own research and talk with a qualified financial advisor before making any investment choices.