
Our stock screening tool has identified AVNET INC (NASDAQ:AVT) as a strong dividend contender with robust fundamentals. AVT exhibits commendable financial health and profitability, all while offering a sustainable dividend. Let's delve into each aspect below.
Understanding AVT's Dividend Score
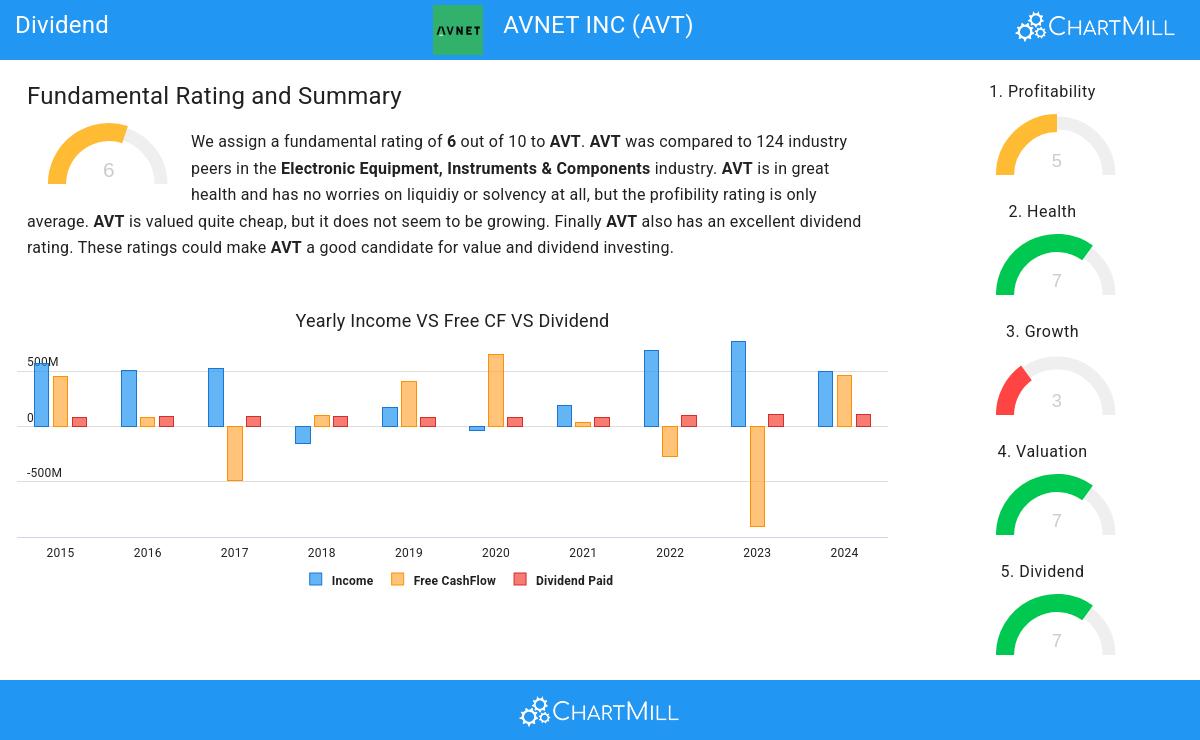
An integral part of ChartMill's stock analysis is the Dividend Rating, which spans from 0 to 10. This rating evaluates diverse dividend factors, including yield, historical data, growth, and sustainability. AVT has received a 7 out of 10:
- Compared to an average industry Dividend Yield of 2.44, AVT pays a better dividend. On top of this AVT pays more dividend than 95.97% of the companies listed in the same industry.
- The dividend of AVT is nicely growing with an annual growth rate of 9.30%!
- AVT has been paying a dividend for at least 10 years, so it has a reliable track record.
- AVT has not decreased their dividend for at least 10 years, which is a reliable track record.
- 35.64% of the earnings are spent on dividend by AVT. This is a low number and sustainable payout ratio.
Health Examination for AVT
Every stock is evaluated by ChartMill, receiving a Health Rating on a scale of 0 to 10. This assessment considers different health aspects, including liquidity and solvency, both in absolute terms and relative to industry peers. AVT has achieved a 7 out of 10:
- AVT has an Altman-Z score of 3.43. This indicates that AVT is financially healthy and has little risk of bankruptcy at the moment.
- With a decent Altman-Z score value of 3.43, AVT is doing good in the industry, outperforming 63.71% of the companies in the same industry.
- The Debt to FCF ratio of AVT is 2.36, which is a good value as it means it would take AVT, 2.36 years of fcf income to pay off all of its debts.
- AVT's Debt to FCF ratio of 2.36 is fine compared to the rest of the industry. AVT outperforms 73.39% of its industry peers.
- Even though the debt/equity ratio score it not favorable for AVT, it has very limited outstanding debt, so we won't put too much weight on the DE evaluation.
- A Current Ratio of 2.39 indicates that AVT has no problem at all paying its short term obligations.
Understanding AVT's Profitability
ChartMill assigns a Profitability Rating to every stock. This score ranges from 0 to 10 and evaluates the different profitability ratios and margins, both absolutely, but also relative to the industry peers. AVT scores a 5 out of 10:
- The Return On Assets of AVT (2.66%) is better than 60.48% of its industry peers.
- AVT's Return On Equity of 6.56% is fine compared to the rest of the industry. AVT outperforms 63.71% of its industry peers.
- Looking at the Return On Invested Capital, with a value of 7.34%, AVT is in the better half of the industry, outperforming 73.39% of the companies in the same industry.
- AVT's Profit Margin has improved in the last couple of years.
- AVT's Operating Margin has improved in the last couple of years.
Our Best Dividend screener lists more Best Dividend stocks and is updated daily.
Our latest full fundamental report of AVT contains the most current fundamental analsysis.
Disclaimer
This article should in no way be interpreted as advice. The article is based on the observed metrics at the time of writing, but you should always make your own analysis and trade or invest at your own responsibility.