
For investors using a methodical technical analysis process, the search for good prospects often depends on two main questions: which stocks are in a solid, clear trend, and when is the best moment to join that trend? A technique that joins a stock's basic technical condition with the state of its present price pattern can address both. This process selects securities that are not only showing firm momentum but are also pausing in a manner that indicates a possible price move is near, giving a more distinct entry point with specific risk.
One security now fitting these strict conditions is AngloGold Ashanti PLC (NYSE:AU), a leading global gold company with a varied set of mining activities in many countries. The firm's recent technical picture indicates it could be ready for its next upward move, based on specialized analysis tools.
Reviewing Technical Condition: A High Ranking
The base of a breakout plan is finding stocks with firm underlying momentum. A superior technical score shows a security is in a definite uptrend, doing better than similar stocks, and showing good agreement along important moving averages. For a trend-based method, this is the necessary "which stock" filter, as it directs money to market front-runners instead of weaker performers.
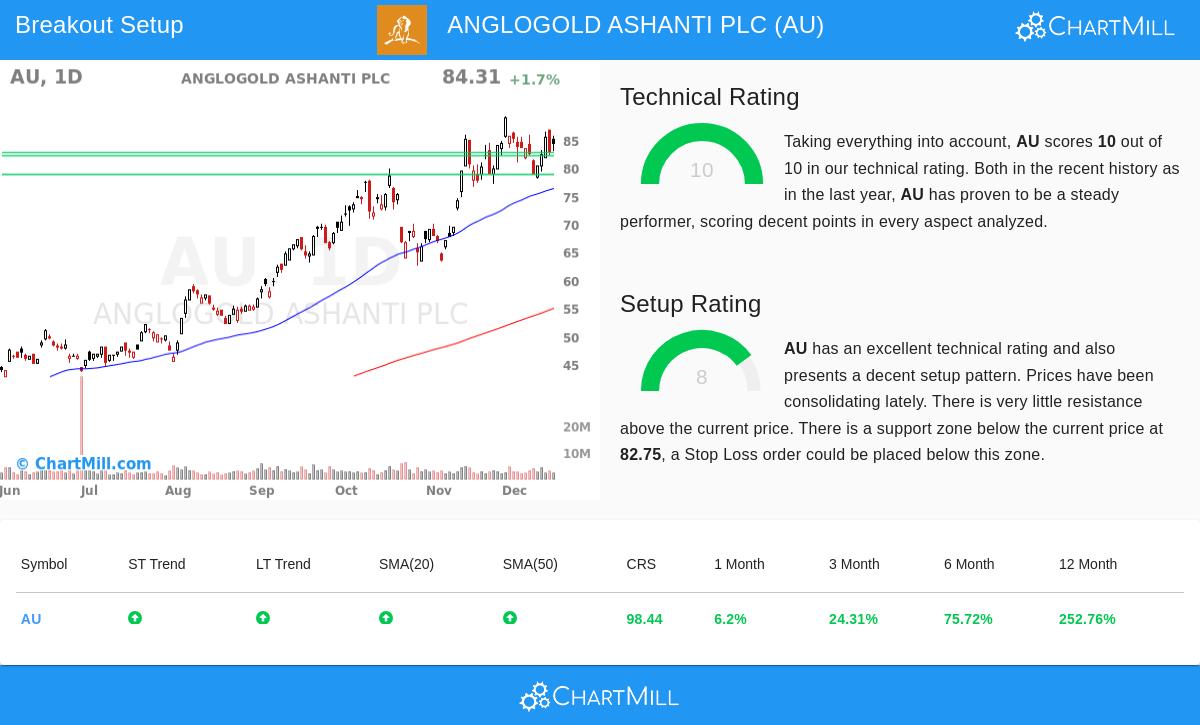
AngloGold Ashanti receives a top mark here. The detailed technical report gives AU a Technical Rating of 10 out of 10, putting it with the best in the whole market. This high score is backed by several strong data items:
- Trend Agreement: Both the long-term and short-term trends for AU are marked as positive, a potent mix that implies continued buying interest across various time frames.
- Strong Relative Performance: The stock's performance over one year puts it in the best 2% of all stocks reviewed. Also, it does better than 89% of similar companies in the Metals & Mining group, showing it leads its sector.
- Price Level: AU is now trading close to its 52-week peak, a typical trait of a stock in a firm upward stage. This condition is significant as it is happening while the general market (S&P 500) is also at peaks, meaning the move is not just a general market rise.
- Moving Average Backing: The stock price is above all its main simple moving averages (20, 50, 100, and 200-day), and each of these averages is also in an upward pattern. This layered positive agreement is a sign of a sound, trending security.
Reviewing the Pattern: A Pause Before the Move
A firm trend by itself does not make a low-risk entry chance. A stock can be "overstretched," having climbed quickly and being distant from any reasonable support, leaving a new buy open to a decline. This is where the Setup Quality score is key. It addresses the "when" by measuring the state of a stock's present pause pattern. A high score shows the price is moving in a narrow band, volatility might be decreasing, and clear support levels are set below, all parts for a possible breakout pattern.
AU shows a Setup Quality Rating of 8, which is seen as good. This means the stock has been pausing its recent advances, forming a base for its next possible action. The analysis states that prices have been moving between $77.07 and $89.19 over the last month, with the present price in the middle. This pause has helped form a specific support area.
- Important Support: A major support zone is found between $82.11 and $82.75, made by a meeting of trendlines and moving averages on daily and weekly charts. For a trader, this gives a reasonable level to set a protective stop-loss order, setting the greatest acceptable risk on the trade.
- Resistance View: The report states there is very little resistance above the present price, implying a clear upward route if a breakout happens from the current pause.
A Possible Trade Plan
Based on this mix of very good technicals and an acceptable setup, the analysis proposes a sample trade structure. It suggests an entry point just above the recent range (near $86.79) on a breakout, with a stop-loss order set below the noted support zone (near $82.10). This would mean a measured risk of about 5.4% on the trade itself. It is important to know this is a sample case made from the technical factors; real entry, exit, and position size must be adjusted to a person's own risk comfort and trade plan.
Locating Like Prospects
The process that found AngloGold Ashanti can be used methodically to the wider market. For investors looking to search for other stocks showing both high technical scores and good setup patterns, a ready-made screen exists. You can view the current list of Technical Breakout Setups here. This screen selects for stocks with a Technical Rating of at least 7 and a Setup Rating of at least 7, offering a daily beginning point for more study.
Disclaimer: This article is for information and learning only. It is not meant as investment guidance, a suggestion, or an offer or request to buy or sell any security. The review shown is based on technical measures and past data, which are not promises of future results. Investing holds risk, including the possible loss of capital. Always do your own research, think about your money situation and risk comfort, and talk with a registered financial advisor before making any investment choices. The sample trade situation described is for example only and does not make up trade guidance.