
For investors using charts and price action to decide, a methodical way to find opportunities is important. One approach looks for stocks that are both technically sound and building a positive pattern, a pairing that can point to a possible breakout. This method centers on two specific scores from ChartMill: the Technical Rating, which measures a stock's general technical condition and direction, and the Setup Quality Rating, which evaluates how neat and clear its present consolidation phase is. The aim is to find leading stocks that are resting after a solid advance, presenting a more distinct entry point with clear risk before their next possible upward move.
A recent filter using this method has pointed to ATI INC (NYSE:ATI) as a notable candidate. The specialty materials company, which operates in important aerospace, defense, and energy sectors, is now displaying a positive technical picture that matches the breakout filter conditions.
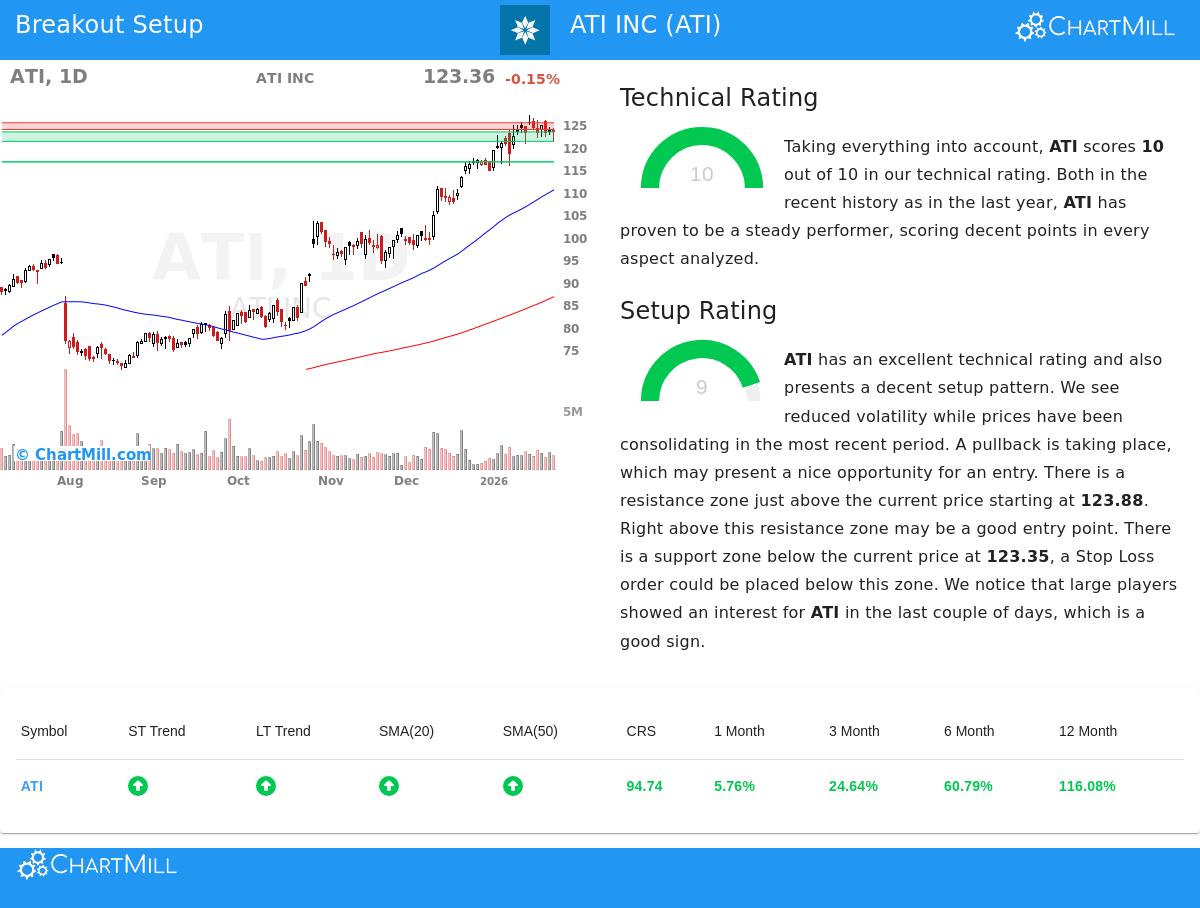
Technical Strength: A Market Leader in a Solid Trend
The base of a good breakout setup is a stock already in a clear, steady upward trend. ATI’s Technical Rating of a full 10 out of 10 first shows very good technical condition. A close look at the full technical report shows the sources of this condition:
- Trend Agreement: Both the near-term and longer-term trends for ATI are marked as positive. This agreement across periods is a strong indicator of steady buying interest and lowers the chance of a quick trend change.
- Relative Performance: ATI is doing better than 94% of all stocks in the market over the last year, clearly marking it as a market leader. This better relative performance is a key filter for breakout scans, as it concentrates on stocks already drawing investment.
- Moving Average Support: The stock is priced above all its main simple moving averages (20, 50, 100, and 200-day), and each of these averages is itself in an upward pattern. This forms a stacked support base under the price.
- Nearness to Highs: ATI is trading close to its 52-week high of $127.11. A stock's capacity to test prior highs frequently points to fundamental strength and an absence of supply above, which is needed for a good breakout.
This solid technical foundation is vital for the method because it makes sure an investor is not trying to buy a declining stock or wager on a turn. Instead, they are aiming to enter an existing, solid trend at a reasonable point.
Setup Quality: A Tight Pattern Waiting for a Catalyst
While a solid trend is needed, it is not enough for a good entry. A stock that has risen sharply may be overstretched and ready for a decline. This is where the Setup Quality Rating is important, as it finds times of consolidation or narrow trading ranges inside the larger upward trend. ATI receives a high Setup Rating of 9, showing it is in such a positive pattern.
The analysis notes a "bull flag" pattern, a standard continuation setup where prices decline slightly in an orderly way after a solid rise. This consolidation has worked to lower volatility and let the stock absorb its earlier gains. For a trader, this pattern gives clearer points for risk control:
- Clear Resistance: A defined resistance area is seen between $123.88 and $125.39. A strong move above this area could signal the restart of the main upward trend and act as a possible trigger for entry.
- Close Support: Several support levels exist below the present price, with the nearest being an area from $121.25 to $123.35. This gives a reasonable place to set a protective stop-loss order, clearly setting the trade's risk if the breakout effort does not succeed.
The high setup score verifies that the stock is not in a disorderly, broad state but is instead gathering force in a narrow range, similar to a tightened spring. This raises the chance that a move above resistance could lead to a significant follow-up.
A Specific Trading Plan
From this technical and setup review, a sample trading plan is created. It proposes a possible entry on a buy-stop order above the resistance at $125.40, with a first stop-loss set below support at $121.24. This would cap the estimated risk on the trade to about 3.3%. It is very important to state this is an example taken from the automated review, real entry points, stop levels, and position size must be adjusted to a person's risk comfort and verified by their own chart review.
Finding More Opportunities The breakout setup that found ATI is not a single event. Investors can use this filter each day to find new possible opportunities as the market shifts. You can see the present list of technical breakout candidates by going to the Technical Breakout Setups screen.
,
Disclaimer: This article is for information only and is not investment advice, a suggestion, or an offer to buy or sell any security. The review and any trade plans described come from automated technical models and are given for learning. Investors should do their own research, think about their money situation and risk comfort, and talk with a qualified financial advisor before making any investment choices. Past results do not guarantee future outcomes.